


Ever spent 30 minutes digging through a wall of identical-looking logs, trying to find the one ERROR buried in 10,000 INFO lines? Spring Boot’s default log format works, but it’s generic. You can’t spot problems fast, your monitoring tools can’t parse it cleanly, and different environments all get the same chatty output. Here’s the thing: customizing your log format takes maybe five minutes, and it pays off every single time you need to debug something in production or filter logs by thread, package, or request ID.
Configuring Log Output Patterns in Application Properties

Spring Boot lets you customize log formats through config files without touching XML or code. The two properties you’ll use most are logging.pattern.console for your terminal and logging.pattern.file for what gets written to disk. These override Spring Boot’s default Logback behavior, letting you shape log output to match your team’s preferences or meet parsing requirements for downstream tools.
Both application.properties and application.yml files support the same pattern syntax. You define your pattern using conversion characters preceded by %, and Spring Boot applies them every time a log event fires. Set both console and file patterns if you want clean, color coded output for developers in the terminal while writing structured, machine parseable logs to files that feed into your monitoring stack.
# application.properties
logging.pattern.console=%d{yyyy-MM-dd HH:mm:ss.SSS} [%thread] %-5level %logger{36} - %msg%n
logging.pattern.file=%d{yyyy-MM-dd HH:mm:ss.SSS} [%thread] %level %logger - %msg%n
The console pattern above uses %-5level for left aligned, padded log levels (makes “INFO” and “ERROR” line up nicely). The file pattern drops the padding since alignment doesn’t matter when you’re piping logs into Elasticsearch or Splunk. %logger{36} limits the logger name to 36 characters, preventing your package names from eating half the line.
Understanding Default Log Format Elements
Without any configuration, Spring Boot uses Logback with a sensible default format that includes timestamp, log level, process ID, thread name, logger name, and the actual message. Here’s what each piece looks like in practice:
| Format Element | Pattern Character | Example Output |
|---|---|---|
| Date and Time | %d or %date | 2024-01-15 14:32:18.547 |
| Log Level | %level or %p | INFO |
| Process ID | %pid or ${PID} | 12345 |
| Thread Name | %thread or %t | [http-nio-8080-exec-1] |
| Logger Name | %logger or %c | com.example.MyService |
| Separator | — | — |
| Message | %msg or %m | User authentication successful |
When you need deeper visibility, activate DEBUG or TRACE levels by running your jar with --debug or --trace flags. These flags override your configuration temporarily, which helps when you’re chasing down a production issue and can’t redeploy just to change a property file.
Common pattern conversion characters you’ll use:
%d{yyyy-MM-dd HH:mm:ss.SSS}– Full timestamp with millisecond precision using SimpleDateFormat syntax%d{ISO8601}– ISO 8601 formatted timestamp, good for international systems%d{yyyy-MM-dd HH:mm:ss.SSS, UTC}– Timestamp in UTC timezone instead of system default%levelor%-5level– Log level, optionally left padded to 5 characters%logger{36}– Logger name truncated to 36 characters, keeps long package names manageable%threador%t– Thread name, wrapped in square brackets by convention%msg%nor%m%n– The actual log message followed by a newline%X{key}– Value from Mapped Diagnostic Context for the specified key, useful for request IDs
Profile-Specific Log Format Configuration
Different environments need different logging setups. Development wants colorful, verbose logs. Production needs structured, minimal output that doesn’t burn through disk space or slow down the app.
# application.yml
spring:
  profiles:
    active: development

---
spring:
  config:
    activate:
      on-profile: development
  output:
    ansi:
      enabled: ALWAYS
logging:
  level:
    root: INFO
    com.example: DEBUG
  pattern:
    console: "%clr(%d{yyyy-MM-dd HH:mm:ss.SSS}){faint} %clr(%5p) %clr(---){faint} %clr([%15.15t]){faint} %clr(%-40.40logger{39}){cyan} %clr(:){faint} %m%n"

---
spring:
  config:
    activate:
      on-profile: staging
logging:
  level:
    root: WARN
    com.example: INFO
  pattern:
    console: "%d{yyyy-MM-dd HH:mm:ss.SSS} %level [%thread] %logger - %msg%n"

---
spring:
  config:
    activate:
      on-profile: production
logging:
  level:
    root: ERROR
    com.example: WARN
  pattern:
    file: "%d{yyyy-MM-dd HH:mm:ss.SSS} %level %logger %msg%n"
  file:
    name: /var/log/myapp/app.log
Spring Boot resolves profile specific properties by merging the active profile section with the default section. Properties in the profile block override defaults, so you can define a baseline format and selectively customize it per environment.
Recommended patterns for different environments:
- Development: Colorful, verbose patterns with full logger names and thread info, DEBUG level enabled
- Staging: Moderate verbosity, INFO level, minimal colors, structured enough for quick debugging
- Production: Minimal pattern to reduce I/O, ERROR and WARN only, often JSON formatted for log aggregators
- Testing: Short patterns without timestamps (they create noise in test output), focused on logger name and message
Log levels work as filters before formatting even kicks in. If you set the root level to WARN, you’ll never see INFO or DEBUG messages no matter how detailed your pattern is. Think of level configuration as the gate and pattern configuration as the shape of what passes through.
Implementing Logback XML Configuration for Advanced Patterns

When you need more control than properties files can give you, create a logback-spring.xml file in your src/main/resources directory. XML configuration lets you define multiple appenders, route different packages to different destinations, apply filters, and build complex patterns that would be awkward to express in a single property value.
<?xml version="1.0" encoding="UTF-8"?>
<configuration>
    <appender name="CONSOLE" class="ch.qos.logback.core.ConsoleAppender">
        <encoder>
            <pattern>%d{yyyy-MM-dd HH:mm:ss.SSS} %clr(%5p) %clr(---){faint} %clr([%15.15t]){faint} %clr(%-40.40logger{39}){cyan} : %m%n</pattern>
            <charset>UTF-8</charset>
        </encoder>
    </appender>

    <root level="INFO">
        <appender-ref ref="CONSOLE" />
    </root>
</configuration>
Logback’s pattern syntax includes all the conversion characters you get in properties files, plus extras like %clr for color coding and more flexible options for date formatting. You can specify exact character widths, truncation behavior, and even conditional formatting based on log level or logger name. The <encoder> element wraps your pattern and handles the actual conversion from log events to byte streams.
Spring Boot’s Logback integration adds Spring specific pattern variables like ${PID} for process ID and ${LOG_LEVEL_PATTERN} for the default level format. You can also reference Spring properties using ${spring.application.name} inside your patterns, which helps when you want the app name in every log line without hardcoding it.
Color-Coded Console Output Configuration
Colored logs make it easier to spot errors and warnings when you’re tailing logs during development. ERROR shows up in red, WARN in yellow, and INFO in default terminal color. Your eyes pick out problems faster when they’re visually distinct.
# application.properties
spring.output.ansi.enabled=ALWAYS
<!-- logback-spring.xml -->
<pattern>
    %clr(%d{yyyy-MM-dd HH:mm:ss.SSS}){faint}
    %clr(%5p)
    %clr(---){faint}
    %clr([%15.15t]){faint}
    %clr(%-40.40logger{39}){cyan}
    : %m%n
</pattern>
The spring.output.ansi.enabled property has three options: ALWAYS forces color codes even if Spring Boot can’t detect terminal support, DETECT (default) checks if the output stream supports ANSI, and NEVER strips all color codes. Use ALWAYS in Docker containers where Spring Boot sometimes misdetects terminal capabilities.
Logback automatically colors log levels (ERROR in bold red, WARN in red, INFO in blue, DEBUG in green, TRACE in gray) when you use %clr without specifying a color. You can override this by adding a color name in braces: %clr(%msg){red}. Not all terminal emulators support ANSI colors perfectly. If you see garbage characters like [31m in your logs, the terminal doesn’t support it, or ANSI detection failed.
Spring Boot looks for Logback configuration files in this order: logback-spring.xml, then logback.xml, then logback-groovy (if Groovy is on the classpath). Use the -spring variant because it gives you access to Spring’s profile specific configuration blocks and property placeholders. If you use plain logback.xml, Spring Boot still finds it, but you lose the Spring specific features.
Creating File-Based Logging with Custom Formats

Production systems need logs on disk, not just in the console. Set logging.file.name to write logs to a specific file path, and customize the format with logging.pattern.file to match whatever your log aggregation tool expects.
# application.properties
logging.file.name=/var/log/myapp/application.log
logging.pattern.file=%d{yyyy-MM-dd HH:mm:ss.SSS} %level [%thread] %logger - %msg%n
The pattern for file logging typically skips colors and fancy formatting since machines will parse it. Keep it simple: timestamp, level, thread, logger, message. If you’re shipping logs to Elasticsearch or Splunk, consider adding a correlation ID from MDC using %X{correlationId} so you can trace requests across multiple log entries.
Rolling policies prevent your log files from consuming all available disk space. Spring Boot’s default rolling policy archives logs daily and keeps them for seven days, but you’ll want to tune this based on your disk capacity and retention requirements. When a log file reaches the size threshold or the date rolls over, Logback compresses the old file to .gz and starts a new one.
<appender name="FILE" class="ch.qos.logback.core.rolling.RollingFileAppender">
    <file>/var/log/myapp/application.log</file>
    <encoder>
        <pattern>%d{yyyy-MM-dd HH:mm:ss.SSS} %level %logger %msg%n</pattern>
    </encoder>
    <rollingPolicy class="ch.qos.logback.core.rolling.SizeAndTimeBasedRollingPolicy">
        <fileNamePattern>/var/log/myapp/archived/application-%d{yyyy-MM-dd}.%i.log.gz</fileNamePattern>
        <maxFileSize>100MB</maxFileSize>
        <maxHistory>30</maxHistory>
        <totalSizeCap>10GB</totalSizeCap>
    </rollingPolicy>
</appender>
File logging best practices:
- Use absolute paths for
logging.file.namein production to avoid issues with working directory changes - Set
maxFileSizebased on how long it takes to process a log file (smaller files are easier to ship and analyze) - Configure
maxHistoryto match your compliance retention requirements, typically 30 to 90 days - Add
totalSizeCapas a safety limit to prevent runaway log growth from consuming all disk space - Use structured formats (JSON) for file logging if you’re sending to a log aggregation system, plain text for manual review
Structured JSON Logging with Spring Boot 3.4

If you’re running Spring Boot 3.4 or higher, built-in structured logging gives you machine readable JSON logs without adding extra dependencies. This makes integration with Elasticsearch, Splunk, or CloudWatch Logs way easier since these tools expect structured data.
Traditional text logs are great for reading with tail -f but terrible for automated analysis. A log line like “User john@example.com logged in from 192.168.1.1” requires regex parsing to extract the email and IP. The same event in JSON includes explicit keys: {"event":"login", "user":"john@example.com", "ip":"192.168.1.1"}. Your log aggregator can filter, group, and analyze these fields without fragile text parsing.
| Format Type | Configuration Property | Use Case |
|---|---|---|
| Elastic Common Schema (ECS) | logging.structured.format.console=ecs | Elasticsearch integration, standardized field names, good for cloud-native observability |
| Graylog Extended Log Format (GELF) | logging.structured.format.console=gelf | Graylog server integration, supports custom fields, designed for centralized logging |
| Logstash JSON | logging.structured.format.console=logstash | Logstash pipelines, simple JSON structure, widely supported by log shippers |
# application.properties - Choose one format

# For Elasticsearch / Elastic Stack
logging.structured.format.console=ecs

# For Graylog
logging.structured.format.console=gelf

# For Logstash
logging.structured.format.console=logstash
Use structured logging when you’re aggregating logs from multiple services and need to search, filter, or alert on specific fields. Stick with text based patterns for local development or when you’re primarily reading logs with your eyes in a terminal. The structured formats add a bit of overhead (larger log files, slightly more CPU to serialize JSON), but the benefits for analysis and troubleshooting in distributed systems usually outweigh the cost.
Log Level Configuration and Package-Specific Formatting
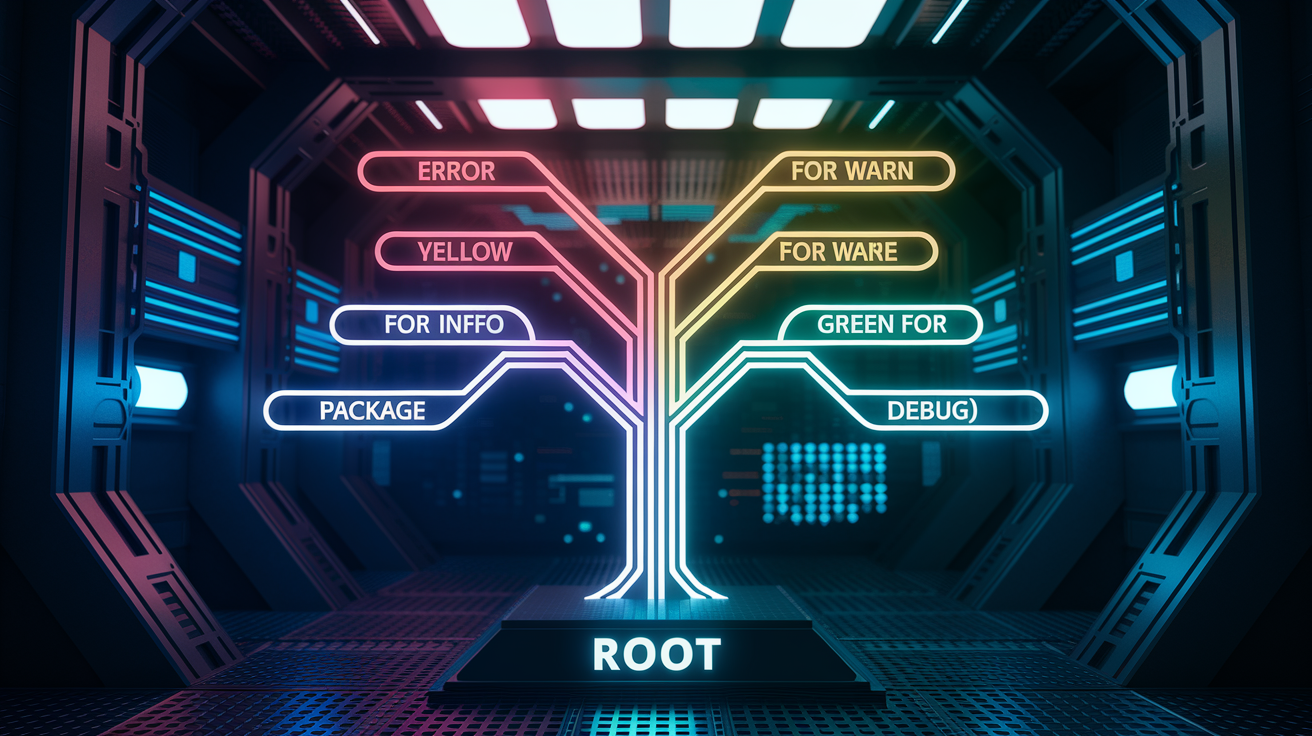
Spring Boot’s logging hierarchy lets you set different levels for different parts of your application. The root logger defines the baseline, and package specific loggers override it for particular namespaces.
# application.properties
logging.level.root=WARN
logging.level.com.example.myapp=INFO
logging.level.com.example.myapp.controller=DEBUG
logging.level.org.springframework.web=DEBUG
logging.level.org.hibernate.SQL=DEBUG
The root level acts as the default for everything. Setting logging.level.com.example.myapp=INFO means all classes in that package (and subpackages) will log at INFO, even though root is set to WARN. More specific packages override less specific ones, so com.example.myapp.controller inherits from com.example.myapp, which inherits from root.
Five standard log levels exist, from most to least verbose:
- TRACE: Extremely detailed flow information, like “Entering method calculateDiscount with parameters: userId=123, cartValue=49.99”. Use this when you need to see every step through a complex algorithm.
- DEBUG: Detailed diagnostic information useful during development, like “Database query returned 47 results in 235ms”. Leave this on for development, turn it off in production unless you’re troubleshooting.
- INFO: Informational messages about normal application flow, like “Application started on port 8080” or “User authentication successful”. This should be your production baseline for most packages.
- WARN: Potentially problematic situations that aren’t errors, like “Connection pool at 80% capacity” or “Deprecated API endpoint called”. These suggest something might need attention but doesn’t require immediate action.
- ERROR: Error events that might still allow the application to continue, like “Failed to process payment, will retry” or “Database connection lost, falling back to cache”. These need investigation.
Level configuration filters messages before pattern formatting happens. If you set a package to ERROR, you’ll never see INFO messages from that package, regardless of how detailed your pattern is. This is useful for silencing noisy third party libraries. Set logging.level.com.chattyvendor=ERROR and you’ll only see their actual errors, not the 500 INFO lines they write per request.
Adding Contextual Information with MDC and Custom Fields

Mapped Diagnostic Context (MDC) lets you attach contextual information to log messages without passing it as a parameter through every method call. Common use cases include correlation IDs that track a request through multiple services, user IDs for multi tenant systems, or transaction identifiers.
import org.slf4j.MDC;

public void processRequest(String userId, String correlationId) {
    MDC.put("correlationId", correlationId);
    MDC.put("userId", userId);

    try {
        // Your business logic here
        logger.info("Processing user request");
        // Logs will include correlationId and userId
    } finally {
        MDC.remove("correlationId");
        MDC.remove("userId");
    }
}
You must call MDC.remove in a finally block. If you don’t clean up MDC values, they leak across requests when threads get reused from the thread pool. This causes logs from one user’s request to show another user’s ID, which is both confusing and potentially a security issue if user IDs are sensitive.
Spring Boot 3.4’s fluent logging API provides cleaner syntax and automatic cleanup:
logger.atInfo()
      .addKeyValue("correlationId", correlationId)
      .addKeyValue("userId", userId)
      .log("Processing user request");
The fluent API automatically clears context after the log statement executes, so you can’t forget cleanup. It’s also more concise when you’re adding multiple fields to a single log message. MDC still makes sense when you want context to propagate across multiple log statements without repeating the addKeyValue calls.
Common MDC use cases:
- Request tracking: Add a unique ID at the start of each HTTP request, include it in all logs during that request, helps correlate logs across distributed traces
- User identification: Add username or user ID in authentication filters, every subsequent log automatically includes who triggered the action
- Transaction boundaries: Add transaction IDs when starting database transactions, makes it easy to find all logs related to a specific transaction
- Session information: Include session IDs for web applications, useful for debugging session related issues or tracking user flows
Spring Boot 3.4’s structured logging includes built-in support for service metadata fields: service.name, service.version, service.environment, and service.node.name. Set these in application.properties and they’ll appear in every structured log entry. This is particularly useful in containerized environments where you want to identify which instance of a service produced a log message.
Implementing Log4j2 as Alternative Formatting Framework

Log4j2 offers better performance than Logback, especially when using async appenders, but requires a bit of dependency wrangling since Spring Boot defaults to Logback.
<!-- pom.xml -->
<dependency>
    <groupId>org.springframework.boot</groupId>
    <artifactId>spring-boot-starter</artifactId>
    <exclusions>
        <exclusion>
            <groupId>org.springframework.boot</groupId>
            <artifactId>spring-boot-starter-logging</artifactId>
        </exclusion>
    </exclusions>
</dependency>

<dependency>
    <groupId>org.springframework.boot</groupId>
    <artifactId>spring-boot-starter-log4j2</artifactId>
</dependency>
Exclude spring-boot-starter-logging from your Spring Boot starter dependencies (it pulls in Logback), then add spring-boot-starter-log4j2. If you forget the exclusion, you’ll end up with both Logback and Log4j2 on the classpath, which causes weird initialization errors.
Log4j2’s pattern syntax differs slightly from Logback. The basics are the same (%d for date, %p for level, %m for message), but advanced features use different syntax. Log4j2’s %highlight replaces Logback’s %clr for colors, and date patterns use different timezone notation.
<?xml version="1.0" encoding="UTF-8"?>
<Configuration status="WARN">
    <Appenders>
        <Console name="Console" target="SYSTEM_OUT">
            <PatternLayout pattern="%d{yyyy-MM-dd HH:mm:ss.SSS} %highlight{%5p} [%t] %c{1.} - %m%n"/>
        </Console>
    </Appenders>
    <Loggers>
        <Root level="info">
            <AppenderRef ref="Console"/>
        </Root>
    </Loggers>
</Configuration>
Spring Boot looks for Log4j2 configuration in log4j2-spring.xml or log4j2.xml. The -spring variant lets you use Spring Boot’s profile specific configuration blocks, similar to Logback. Without it, you lose the ability to have different configurations per Spring profile.
Log4j2’s async logging can significantly reduce the performance impact of logging in high throughput applications. Where synchronous logging blocks your application thread until the log message is written, async logging hands off to a background thread and returns immediately. This matters most in request handling threads where every millisecond counts.
Building Custom StructuredLogFormatter Implementations

When the built-in formats don’t match your needs (maybe you’re integrating with a proprietary log management system or have specific compliance requirements), implement StructuredLogFormatter to define your own format.
package com.example.logging;

import org.springframework.boot.logging.structured.StructuredLogFormatter;
import org.springframework.boot.logging.structured.JsonWriter;
import org.springframework.boot.logging.LogLevel;

public class CustomLogFormatter implements StructuredLogFormatter<Event> {

    private final JsonWriter writer = JsonWriter.of(this::writeEvent);

    @Override
    public String format(Event event) {
        return writer.write(event);
    }

    private void writeEvent(Event event, JsonWriter.MemberWriter memberWriter) {
        memberWriter.add("timestamp", event.getInstant().toEpochMilli());
        memberWriter.add("severity", event.getLevel().name());
        memberWriter.add("message", event.getMessage());
        memberWriter.add("logger", event.getLoggerName());

        // Add custom business fields
        memberWriter.add("service", "payment-processor");
        memberWriter.add("region", System.getenv("AWS_REGION"));
    }
}
Reference your custom formatter in application.properties using the fully qualified class name:
logging.structured.format.console=com.example.logging.CustomLogFormatter
Spring Boot 3.4’s JsonWriter class handles JSON encoding without requiring Jackson or Gson. It escapes strings properly, handles null values, and writes compact JSON. If you need formatted JSON with indentation, you’ll still need to bring in a JSON library and handle serialization yourself.
Custom formatters aren’t limited to JSON. You can return any string format, including key value pairs for legacy systems that expect specific field separators:
@Override
public String format(Event event) {
    return String.format("timestamp=%d|level=%s|message=%s|logger=%s",
                         event.getInstant().toEpochMilli(),
                         event.getLevel(),
                         event.getMessage(),
                         event.getLoggerName());
}
Use custom formatters when integrating with specialized logging infrastructure (like mainframe systems with fixed width field requirements), meeting specific compliance standards that require particular field ordering or naming, or adding computed fields based on application state (like circuit breaker status or current load metrics). For most use cases, stick with the built-in ECS or Logstash formats and use MDC for custom fields.
Logging Performance Optimization and Best Practices

Logging has a cost: CPU time for string formatting, I/O for writing to disk, and memory for buffering. In high throughput applications, logging can become a bottleneck if you’re not careful.
Logging best practices that balance visibility and performance:
- Match log levels to environment: ERROR and WARN only in production, INFO for staging, DEBUG for development. Each additional level increases volume exponentially.
- Use async appenders for high throughput paths: Hand off logging to a background thread so request handlers don’t block on I/O. Watch out for log loss if the async buffer fills up during traffic spikes.
- Avoid logging in tight loops: If you’re processing 10,000 records, log every 1,000 instead of every iteration. Aggregate metrics and log summaries.
- Use structured logging in production: JSON formats make it easier for log aggregators to parse and index, which means you can query logs instead of grepping through gigabytes of text files.
- Configure rotation and retention: Set
maxFileSizeto prevent any single file from growing too large, andmaxHistoryto automatically delete old logs. Monitor disk usage. - Mask sensitive data: Use custom patterns or MDC filters to redact passwords, credit card numbers, and other PII before it hits log files.
- Use conditional logging for expensive operations: Instead of
logger.debug("Result: " + expensiveOperation()), useif (logger.isDebugEnabled()) { logger.debug("Result: " + expensiveOperation()); }so the operation doesn’t run when DEBUG is off.
Async logging provides significant performance benefits when your application writes enough logs that I/O becomes a bottleneck. Log4j2’s async appender uses a lock free queue to hand off log events to a background thread. Spring Boot with Logback can also use async appenders through XML configuration.
<appender name="ASYNC" class="ch.qos.logback.classic.AsyncAppender">
    <queueSize>512</queueSize>
    <discardingThreshold>0</discardingThreshold>
    <appender-ref ref="FILE" />
</appender>
The tradeoff with async logging is potential log loss during sudden shutdowns. If your application crashes or gets killed, messages still in the async buffer might not make it to disk. Set discardingThreshold to 0 to keep all messages, or accept that DEBUG and TRACE messages might get dropped during high load by keeping the default threshold. For most applications, the performance gain outweighs the risk of losing a few log messages during abnormal termination.
Monitor logging overhead by tracking metrics like queue depth (for async appenders), log file write latency, and disk space consumption. If you see queues consistently full or write latency spiking, either reduce log volume or increase buffer sizes. If disk space grows faster than expected, tighten rotation policies or reduce log retention.
Final Words
Your Spring Boot log format choices directly impact how quickly you can debug issues and ship reliable code.
Start with application.properties for basic customization, move to Logback XML when you need color coding or complex patterns, and consider structured JSON logging if you’re feeding logs to Elasticsearch or Splunk.
Package-level logging and MDC context give you the precision you need during incidents. Rolling file policies keep disk usage under control.
The right logging setup saves you hours when production breaks at 2 AM. Pick the format that matches your tooling, keep patterns readable, and you’ll spend less time hunting bugs.
FAQ
What is the default log format in Spring Boot?
The default log format in Spring Boot includes date, time with millisecond precision, log level, thread name in square brackets, logger source class name, process ID, and the log message. This format provides comprehensive information for debugging without requiring any configuration changes.
How do I customize log patterns in application.properties?
You customize log patterns in application.properties by using the logging.pattern.console and logging.pattern.file properties. These properties override Spring Boot’s default logging behavior and let you specify different formats for console and file outputs using pattern elements like %d for date and %msg for message.
What pattern elements can I use in Spring Boot log formats?
Spring Boot log patterns support elements including %d for date with customizable formats, %thread for thread name, %level or %-5level for log level with optional padding, %logger for logger name, and %msg for the message. You can combine these with separators and color codes for comprehensive formatting.
What are the five log levels in Spring Boot?
The five log levels in Spring Boot are TRACE, DEBUG, INFO, WARN, and ERROR, listed from most to least verbose. By default, only ERROR, INFO, and WARN messages print to the console, but you can enable DEBUG and TRACE using --debug or --trace flags.
When should I use logback-spring.xml instead of application.properties?
You should use logback-spring.xml when you need more complex log formatting scenarios like color-coded console output, multiple appenders with different patterns, or conditional logging based on profiles. XML configuration provides finer control than properties files for advanced use cases.
How do I enable color-coded console output in Spring Boot?
You enable color-coded console output in Spring Boot by setting spring.output.ansi.enabled to ALWAYS, DETECT, or NEVER in application.properties. Alternatively, use the %clr pattern element in logback-spring.xml to assign custom colors to specific log elements for visual parsing during development.
What’s the difference between logging.file.name and logging.file.path?
logging.file.name specifies the complete file path and name for your log file, while logging.file.path sets only the directory where Spring Boot creates a default-named log file. You only need to configure one of these properties to enable file-based logging.
How do I configure log file rotation in Spring Boot?
You configure log file rotation in Spring Boot using RollingFileAppender in logback-spring.xml with rolling policies that specify size limits and archive compression strategies. Rolling policies prevent creating huge log files by archiving old logs in the logs folder when size or time thresholds are met.
What is structured logging in Spring Boot 3.4?
Structured logging in Spring Boot 3.4 is the built-in support for machine-readable JSON log formats including Elastic Common Schema, Graylog Extended Log Format, and Logstash JSON. You enable it by setting logging.structured.format.console=ecs in application.properties for easier log aggregation and parsing.
When should I use structured JSON logging versus traditional text logs?
You should use structured JSON logging when integrating with log management systems like Elasticsearch, Splunk, or the ELK stack that parse machine-readable formats. Traditional text-based formats work better for simple local development or when human readability during direct file inspection is the priority.
How do I set different log levels for specific packages?
You set different log levels for specific packages using logging.level.com.example properties in application.properties, where com.example is your package name. This lets you enable DEBUG logging for your application code while keeping third-party libraries at INFO or WARN level.
What is MDC and how does it add context to logs?
MDC (Mapped Diagnostic Context) is a class that allows adding custom information like user IDs or correlation IDs to log messages. You use MDC.put to add context and must call MDC.remove afterward to prevent memory leaks, or use the fluent logging API for automatic cleanup.
How do I switch from Logback to Log4j2 in Spring Boot?
You switch from Logback to Log4j2 by excluding the default spring-boot-starter-logging dependency and adding spring-boot-starter-log4j2 to your pom.xml. Log4j2 recognizes configuration files named log4j2-spring.xml or log4j2.xml and offers async logging capabilities for better performance.
How do I create a custom StructuredLogFormatter implementation?
You create a custom StructuredLogFormatter by implementing the StructuredLogFormatter interface and overriding the format method to return your desired output format. Reference your custom formatter in application.properties using logging.structured.format.console=com.example.MyFormatter with the fully qualified class name.
What are best practices for logging performance in Spring Boot?
Logging performance best practices include using appropriate log levels for each environment, enabling async appenders for high-throughput scenarios, avoiding excessive logging in hot code paths, using structured formats for analysis, configuring log file rotation, and implementing conditional logging to reduce overhead.