


Think your logs are fine as-is?
A log level formatter decides where the timestamp goes, how the severity shows up, and which module or line number appears, turning raw events into readable, actionable output.
In this post you’ll learn when to pick compact console formats, when to emit JSON for aggregators, and a few quick, practical examples in Python, Java, and Node to make your logs actually helpful during debugging.
Core Concepts of Log Level Formatting

A log level formatter controls how your application presents log messages, turning raw events into structured, readable output. At its simplest, a formatter defines where the timestamp goes, how the severity level appears, which module or logger name gets included, and how the actual message content shows up. Without a formatter, logs appear as bare strings with zero context. Good luck debugging production issues or tracing request flows across services when that happens.
The formatting layer sits between the logging library and the output destination. When your code calls log.info("User logged in"), the logger creates a LogRecord containing metadata like timestamp, level, module name, and line number. Then it passes that record to a handler. The handler applies a formatter to turn the LogRecord into a string, and finally writes that string to a file, console, or remote system. This separation lets you send the same log event to multiple destinations with different formatting. Compact console output for local dev, detailed JSON to a centralized aggregator for production.
Every log message typically includes four essential parts:
- Timestamp — the exact moment the event occurred, ideally in UTC with timezone information so you can correlate logs across distributed services and time zones.
- Log level — the severity indicator (DEBUG, INFO, WARNING, ERROR, CRITICAL) that tells you how urgent the event is and helps filter noise during troubleshooting.
- Logger or module name — identifies which part of your codebase generated the message, crucial for pinpointing the source of errors in large applications.
- Message content — the actual human-readable or structured payload describing what happened, often including variable data like user IDs or request paths.
Most logging libraries ship with a default formatter that outputs these parts in a basic pattern. Python’s logging library, for example, uses a format string like "%(levelname)s - %(message)s" to produce output such as INFO - Server started on port 8080. Node.js libraries like Winston and Bunyan let you define format functions or use built-in presets. Java’s Log4j uses PatternLayout with tokens like %d for date and %p for level.
Here’s the thing: formatters are configurable templates. The defaults are just starting points. You should customize them to match your team’s debugging workflow and your infrastructure’s log aggregation requirements.
Python Logging Formatter Examples

Python’s logging module uses Formatter objects to control message appearance. You create a Formatter by passing a format string containing placeholders like %(asctime)s for timestamps, %(levelname)s for log level, %(name)s for the logger name, and %(message)s for the actual log content. Each Handler can have its own Formatter, so you can send concise messages to the console and detailed entries to a file using the same logger.
Here’s a basic example that includes timestamps and levels:
import logging

logging.basicConfig(
    level=logging.DEBUG,
    format='%(asctime)s - %(levelname)s - %(message)s',
    datefmt='%Y-%m-%d %H:%M:%S'
)

logger = logging.getLogger(__name__)
logger.info("Application started")
logger.debug("Loading configuration from disk")
logger.error("Failed to connect to database")
This produces output like:
2023-05-30 14:30:10 - INFO - Application started
2023-05-30 14:30:10 - DEBUG - Loading configuration from disk
2023-05-30 14:30:11 - ERROR - Failed to connect to database
For more control, you can assign custom Formatter instances to individual handlers. This example sends aligned, detailed logs to a file and simple messages to the console:
import logging
import sys

logger = logging.getLogger("myapp")
logger.setLevel(logging.DEBUG)

# Console handler: concise format
console_handler = logging.StreamHandler(sys.stdout)
console_handler.setLevel(logging.INFO)
console_formatter = logging.Formatter('%(levelname)-8s %(message)s')
console_handler.setFormatter(console_formatter)

# File handler: detailed format with module name
file_handler = logging.FileHandler("app.log")
file_handler.setLevel(logging.DEBUG)
file_formatter = logging.Formatter(
    '%(asctime)s [%(levelname)-8s] %(name)s:%(lineno)d - %(message)s',
    datefmt='%Y-%m-%d %H:%M:%S'
)
file_handler.setFormatter(file_formatter)

logger.addHandler(console_handler)
logger.addHandler(file_handler)

logger.info("User session created")
logger.debug("Cache miss for key: user_profile_42")
Console output shows INFO User session created, while the file gets 2023-05-30 14:30:12 [INFO ] myapp:15 - User session created. Notice %(levelname)-8s uses left alignment with a fixed width of 8 characters, keeping levels visually aligned.
Three customization tips to improve readability and integration:
- Add colors for console output. Use third-party libraries like
colorlogorRichto apply ANSI color codes based on log level, making warnings and errors pop during development. - Include source file and line number. Add
%(filename)s:%(lineno)dto quickly jump to the code that logged the message when debugging production issues. - Switch to JSON for production. Replace the format string with a custom Formatter that outputs JSON objects (
{"timestamp": "...", "level": "INFO", "message": "..."}) so log aggregators can parse and index fields without regex parsing.
Log4j and Java Formatting Techniques

Log4j and its successor Log4j2 use PatternLayout to define log message structure. You configure patterns in XML, properties files, or programmatically, using tokens that start with %. Common tokens include %d for date/time, %p or %level for log level, %c or %logger for logger name, %m or %msg for the message, and %n for a newline. PatternLayout is flexible, supporting alignment, padding, color, and conditional formatting based on log level or custom fields.
A basic Log4j2 configuration might look like this in log4j2.xml:
<Configuration>
  <Appenders>
    <Console name="Console" target="SYSTEM_OUT">
      <PatternLayout pattern="%d{yyyy-MM-dd HH:mm:ss} [%level] %logger{36} - %msg%n"/>
    </Console>
  </Appenders>
  <Loggers>
    <Root level="info">
      <AppenderRef ref="Console"/>
    </Root>
  </Loggers>
</Configuration>
This pattern produces output like 2023-05-30 14:30:15 [INFO] com.example.MyService - Request processed successfully. The %d{...} part specifies a custom date format, and %logger{36} truncates the logger name to 36 characters if it’s longer, keeping output compact.
For an advanced pattern with alignment and color codes, you can use highlight or ANSI styling in Log4j2:
<Console name="ColorConsole" target="SYSTEM_OUT">
  <PatternLayout>
    <Pattern>%d{HH:mm:ss.SSS} %highlight{%-5level}{FATAL=red, ERROR=red, WARN=yellow, INFO=green, DEBUG=cyan, TRACE=blue} %style{%logger{1.}}{cyan} - %msg%n</Pattern>
  </PatternLayout>
</Console>
This pattern aligns log levels to 5 characters with %-5level, applies color highlighting per level (ERROR and FATAL in red, WARN in yellow), and colors the logger name in cyan. %logger{1.} shortens package names to their first letter, so com.example.service.UserService becomes c.e.s.UserService, saving horizontal space. The result is a colorized, scannable console output where severity jumps out visually.
Configuration best practices include keeping production patterns simple and machine-parseable (avoid colors in JSON logs), using alignment for readability in development, and storing pattern definitions in external config files so you can adjust formatting without recompiling code. Always include timestamps and levels. Add correlation IDs via MDC (Mapped Diagnostic Context) so you can trace requests across microservices. If you’re shipping logs to Elasticsearch or a similar system, consider using JsonLayout instead of PatternLayout to emit structured JSON that’s easier to query.
Cross‑Language Formatting Approaches

Node.js logging libraries like Winston and Pino offer flexible formatting through format functions and built-in presets. Winston uses a pipeline of format transformers. You can chain format.timestamp(), format.colorize(), and format.printf() to build custom output. A typical Winston setup looks like winston.createLogger({ format: format.combine(format.timestamp(), format.json()), transports: [new transports.Console()] }), producing JSON lines with timestamps, levels, and messages.
Pino takes a performance-first approach, logging JSON by default and deferring prettification to a separate CLI tool (pino-pretty) so production logging stays fast. Both libraries support custom formatters via functions that receive a log object and return a formatted string or object.
Go’s logging ecosystem includes logrus and zerolog, each with different formatting philosophies. Logrus uses a Fields pattern where you add structured key-value pairs to each log entry, then choose a formatter (TextFormatter for human-readable output or JSONFormatter for structured logs). For example, log.WithFields(logrus.Fields{"user": "alice", "action": "login"}).Info("User logged in") produces time="2023-05-30T14:30:20Z" level=info msg="User logged in" action=login user=alice.
Zerolog prioritizes zero-allocation performance and always outputs JSON, letting you chain method calls like log.Info().Str("user", "alice").Msg("User logged in") to build structured entries without reflection overhead. Both libraries emphasize structured logging over free-form messages, making them solid choices for high-throughput services.
Ruby’s standard Logger class ships with a simple formatter that prints timestamps, severity, program name, and messages. The default format is [timestamp] SEVERITY ProgName: message, but you can override it by setting logger.formatter = proc { |severity, datetime, progname, msg| ... }. Community gems like semantic_logger extend Ruby’s logging with structured fields, tagging, and pluggable appenders. Ruby’s logging is less opinionated than Go or Node.js, giving you full control but requiring more manual setup to get structured output.
| Language | Common Formatter | Default Output Style |
|---|---|---|
| Node.js (Winston/Pino) | format.combine(), format.json() | JSON lines with timestamp, level, message |
| Go (logrus/zerolog) | JSONFormatter / zerolog default | Structured JSON with fields |
| Ruby (Logger) | Proc-based formatter | Text: [timestamp] SEVERITY ProgName: message |
Advanced Customization: Colors, Alignment, and Structured Output

Colorization and alignment make logs easier to scan during development. ANSI color codes let you highlight log levels. ERROR in red, WARNING in yellow, INFO in green. That way urgent messages stand out in a terminal scroll. Alignment ensures that log levels, timestamps, and logger names line up in columns, reducing visual clutter.
Structured formats like JSON or key-value pairs shift from human-first to machine-first readability, embedding metadata as parseable fields so aggregation tools can index, filter, and correlate logs without regex gymnastics. The tradeoff is that raw structured logs are harder to read in a terminal, so many teams use colors and alignment for local dev, then switch to JSON for production stdout or file logging.
Common customization methods include:
- ANSI escape codes for color. Wrap log levels in sequences like
\033[31mfor red or\033[33mfor yellow, then reset with\033[0m. Libraries like Python’scolorlogor Node’schalkhandle this automatically. - Fixed-width formatting. Use alignment specifiers (
%-8sin Python,%-5levelin Log4j) to pad or truncate fields, creating neat columns that are easier to scan. - Conditional formatting by level. Subclass your formatter to add prefixes (like “URGENT” for ERROR logs) or change field order based on severity, drawing attention to critical events.
- Including MDC or request context. Add correlation IDs, user IDs, or trace IDs to every log entry so you can filter all logs for a single request across multiple services.
- Switching formatters per environment. Use environment variables to toggle between colorized console output in development and JSON output in staging/production, keeping the same logging calls in your code.
Advanced formatting is powerful for debugging, but don’t overdo it. Complex formatters that call external services or perform heavy processing can slow down high-throughput logging. If you’re logging thousands of events per second, profile your formatter to ensure it’s not a bottleneck. In production, prefer simple JSON formatters over fancy console styling. Structured logs integrate cleanly with Elasticsearch, Loki, or CloudWatch, and you can always pipe them through a prettifier (jq, pino-pretty) when you need to read them manually.
Best Practices for Log Level Formatting
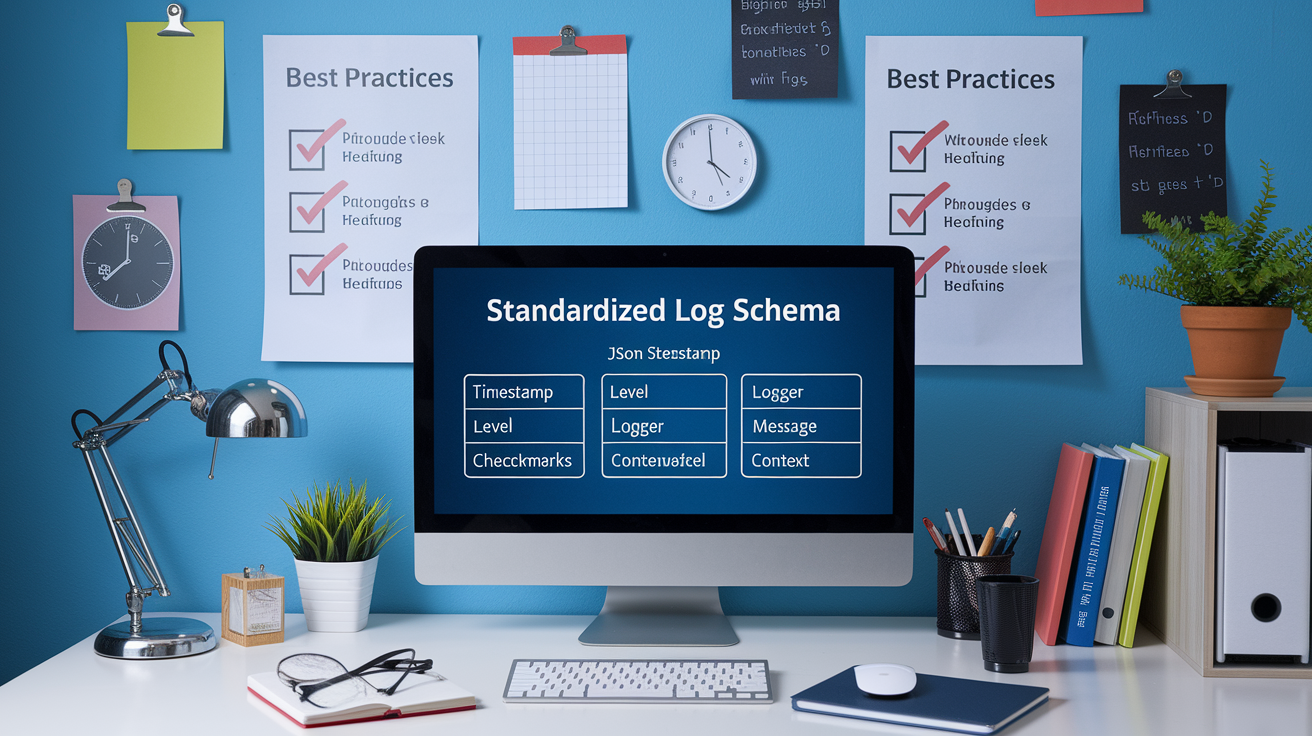
Consistency across services and environments is the foundation of effective logging. If one service logs timestamps as ISO 8601 UTC and another uses local time without timezone info, correlating events becomes guesswork. Pick a standard format, preferably JSON with a fixed set of fields (timestamp, level, logger, message, context), and apply it everywhere. This uniformity lets you build dashboards, alerts, and search queries that work across your entire stack without special-casing each service’s log format.
Clarity in level usage prevents alert fatigue and speeds up troubleshooting. Use DEBUG for verbose detail you only need when hunting a specific bug, INFO for normal operational events (server started, request completed), WARNING for recoverable issues (retrying a failed request, deprecated API usage), ERROR for failures that need attention (database timeout, failed validation), and CRITICAL for system-wide emergencies (out of memory, unable to bind to port). Align your format to highlight severity. Color-code ERROR and CRITICAL in dev, or add extra context fields (stack trace snippet, user ID) at those levels so on-call engineers can jump straight to the problem.
Avoiding unnecessary data in high-load systems keeps log volume manageable and performance stable. Resist the urge to log every variable or request header. Focus on actionable fields like request ID, user ID, endpoint, status code, and duration. Structured logging makes it easy to add fields, but each field increases storage costs and indexing time.
In production, skip verbose stack traces for INFO-level logs, and throttle or sample high-frequency events (like cache hits) to avoid overwhelming your aggregation system. Profile your logging pipeline under load to ensure formatters and handlers aren’t blocking application threads or consuming excessive CPU.
Final Words
In the action, we ran through why consistent log formatting speeds debugging and makes observability useful.
You saw Python Formatter examples, Log4j pattern layouts, cross-language approaches, and tips for colors, alignment, and structured JSON.
Keep logs lean: timestamp, level, message, context. Use consistent patterns and avoid noisy fields in high‑load paths.
Pick and document a simple log level formatter, apply it across handlers, and you’ll get faster triage and clearer alerts — ship with more confidence.
FAQ
Q: What is log level formatting and why does it matter?
A: Log level formatting is how you display timestamp, level, module, and message; it matters because consistent formatting speeds debugging, enables reliable alerts, and lets log tools parse entries for analysis.
Q: Which common log levels should I use?
A: The common log levels are DEBUG, INFO, WARNING, ERROR, and CRITICAL; use DEBUG for development detail, INFO for normal operations, WARNING for recoverable issues, and ERROR/CRITICAL for serious failures.
Q: What are the essential parts of a log message?
A: The essential parts of a log message are timestamp, level, logger/module name, and the message; include context fields like request id or user when you need cross-service tracing.
Q: How do Python logging formatters work?
A: Python logging formatters are Formatter objects that convert record fields (e.g., %(asctime)s, %(levelname)s, %(name)s, %(message)s) into strings; handlers attach formatters so different outputs get different formats.
Q: How do I create a basic Python logging format string?
A: A basic Python format string is “%(asctime)s – %(levelname)s – %(name)s – %(message)s”; pass it to logging.Formatter and attach that formatter to a handler for console or file output.
Q: How can I add colors or alignment to Python logs?
A: You can add colors and alignment by using third-party packages (colorlog, rich) or custom formatters that inject ANSI codes and pad level names in the format string for neat columns.
Q: How does Log4j PatternLayout formatting work?
A: Log4j’s PatternLayout uses tokens like %d (date), %p (level), %c (logger), and %m (message); you build patterns, add ANSI color codes, or use RegexReplacement for advanced formatting tweaks.
Q: When should I use structured JSON logging instead of plain text?
A: Use structured JSON logging when you need reliable parsing, searching, and aggregation with tools like ELK or Datadog; stick to plain text for local debugging and small-volume human reading.
Q: How do different languages handle log formatting?
A: Different languages share fields but use different libraries: Node.js (Winston/Pino) and Go (logrus/zerolog) favor JSON output, while Ruby’s Logger is text-first but supports custom formatters.
Q: What are best practices for log level formatting?
A: Best practices: keep a consistent structure, use clear level semantics, always include timestamps and minimal context, and avoid overly verbose formats in high-throughput production systems.