


Stop treating logs like text files, treat them like data.
Graylog extractors parse incoming messages the moment they hit an input, turning messy lines or JSON blobs into named fields you can search, filter, and graph.
That makes searches faster, dashboards more useful, and alerts reliable.
The catch: extractors only run on new messages, so scope and test them with a real sample in the UI to avoid wasted CPU.
This post shows which extractor types to use, quick setup steps, and common gotchas so you can stop grepping and start building useful views.
Understanding Graylog Extractors and Their Core Function in Log Parsing

Graylog extractors turn messy incoming log messages into structured fields the second they land on an input. A syslog line or JSON blob shows up, the extractor parses it, and each piece gets written into a named field. Those fields go straight into Elasticsearch as part of the indexed document. You can search them, filter them, build visualizations on them. Without extractors, you’re stuck grepping through full_message strings.
Extractors run on inputs—Syslog UDP, Syslog TCP, GELF, Beats—and only touch messages received after you create them. Build an extractor today? Yesterday’s logs stay untouched. That’s intentional. It keeps Graylog fast and predictable. Each extractor reads a field (usually full_message or message), runs its parsing logic, writes zero or more new fields into the event before indexing.
Core extractor types and what they’re for:
- Regular Expression: Grab specific patterns from arbitrary text. Think IP addresses or timestamps in custom log formats.
- Grok: Use readable, reusable patterns (like %{INT} or %{TIMESTAMP_ISO8601}) to parse syslog, web server logs, DNS messages without writing raw regex.
- JSON: Parse embedded JSON payloads and flatten nested structures into top level fields for easy filtering.
- Key‑Value: Extract field=value pairs from logs that use a delimiter, common in application debug output.
- CSV: Split delimited records into columns when your log producer spits out comma or tab separated values.
Structured fields improve every downstream use case. Dashboards can graph counts by hostname or log level. Alerts trigger when a specific field crosses a threshold. Searches return results in milliseconds because Elasticsearch indexes each field. Long term retention gets cheaper when you drop high cardinality raw messages and keep only the fields you need. That’s why extractors are the first step after getting logs into Graylog.
Graylog Extractor Setup Workflow: Creating Your First Extractor in the UI

Extractors attach to an input, so start by picking the input that receives the logs you want to parse. Load a real sample message from that input to test your pattern before you save. The UI lets you try the extractor against live data, see what fields it creates, iterate until the output looks right. Testing with a representative message catches edge cases before they hit production.
Scoping extractors correctly prevents CPU waste. If an extractor runs a complex regex on every message—even messages from a different application—you’ll burn cycles for no return. Use conditions to restrict processing to messages that contain a known substring or match a simple pattern. Regex based conditions are more precise than substring checks. They let you skip extraction when a log line doesn’t fit the expected format. Extractors fail silently for non matching messages, so scoping ensures you only pay the parsing cost when it’s likely to succeed.
UI workflow to create an extractor:
- Navigate to System → Inputs and locate the input receiving your target logs.
- Click Show Received Messages to open a live stream of recent messages on that input.
- Click Manage extractors to open the extractor management dialog.
- Click Add extractor and choose Load Message to select a sample message from the stream.
- Select the message field you want to parse (typically full_message or message).
- Choose the extractor type (Regex, Grok, JSON, etc.) from the dropdown.
- Enter your pattern or configuration, add any conditions, click Try to preview the extracted fields.
- Name the extractor, confirm the extraction strategy (usually Copy to preserve the original field), click Create extractor.
Grok and Regex Graylog Extractors: Pattern Examples and Practical Guidance

GROK is preferred over raw regex because it makes long parsing rules readable and reusable. A GROK pattern is just regex with a friendly name. Instead of writing (?:[+-]?(?:[0-9]+)) to match an integer, you write %{INT}. Instead of a 200 character regex to match a timestamp, you write %{TIMESTAMP_ISO8601}. When you come back six months later, you’ll understand what %{IP:client_ip} does without decoding escape sequences.
Named captures in GROK create fields. The syntax %{PATTERN:fieldname} extracts the matched text and stores it under fieldname in the indexed message. Use an online GROK debugger—think regex101 but for GROK—to design and test patterns before pasting them into Graylog. Load a sample log line, try a pattern, see which fields appear, adjust until you get the structure you need. GROK debugging is faster than the Graylog UI iteration loop because you can tweak and rerun instantly.
Converting large regex into GROK sequences starts with identifying repeating chunks. If you’re matching an IP address in three places, replace each occurrence with %{IP}. If you’re parsing a date, replace the raw pattern with %{DATE} or %{DATESTAMP}. Common mistakes: forgetting to escape special characters inside custom patterns, nesting too many patterns without testing each layer, assuming GROK will infer field names (you must name captures explicitly with the colon syntax).
GROK pattern examples:
%{INT:bytes_sent}— Captures an integer and stores it in the bytes_sent field, useful for parsing response sizes from web server logs.%{IP:client_ip} - - \[%{HTTPDATE:timestamp}\]— Extracts client IP and timestamp from a typical Apache access log line.%{SYSLOGBASE} %{GREEDYDATA:log_message}— Parses standard syslog headers and captures everything after the header as log_message.%{WORD:log_level}: %{GREEDYDATA:error_detail}— Matches lines that start with a log level (INFO, WARN, ERROR) followed by a colon and freeform text.
JSON, Key‑Value, and CSV Extractors: Parsing Structured Payloads in Graylog
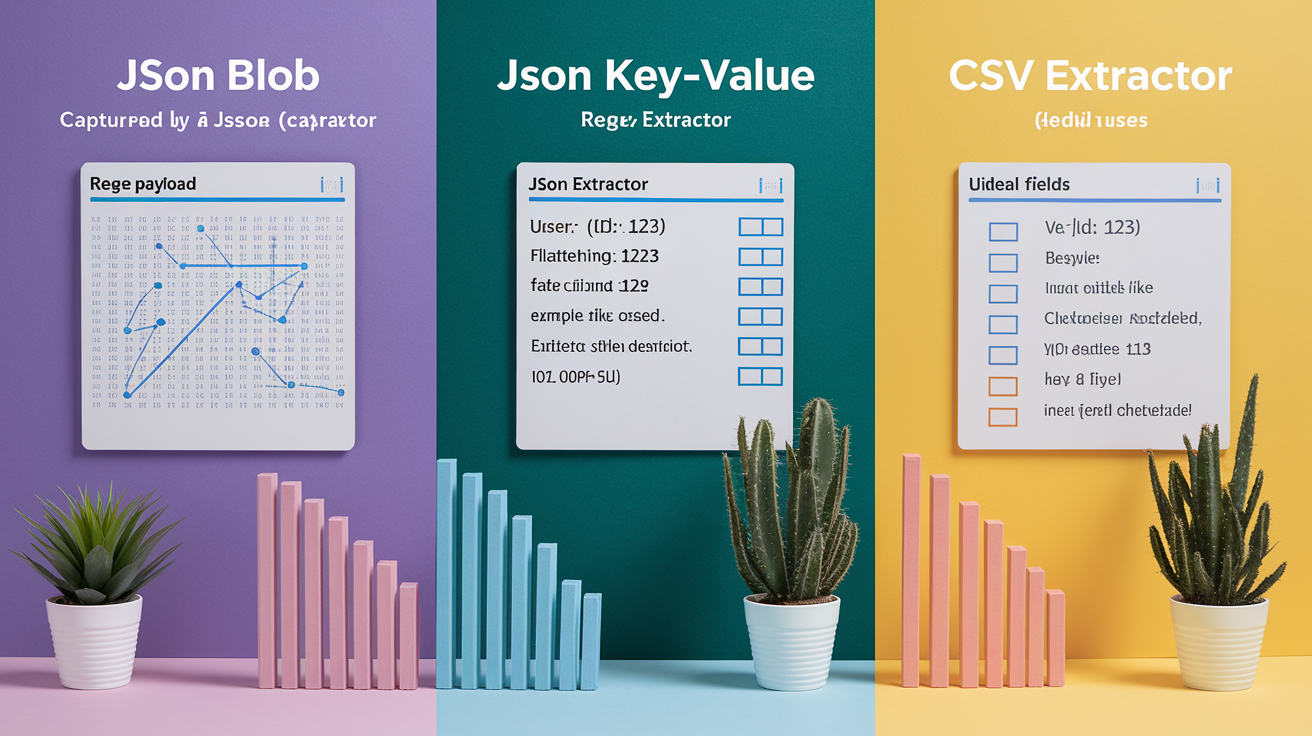
JSON extraction typically uses a two extractor workflow. First, use a regex extractor to capture the JSON blob from the raw message and store it in a dedicated field (e.g., jsonpayload). Then add a JSON extractor that reads jsonpayload, parses it, creates one field per JSON key. For nested JSON, Graylog can flatten the structure, turning {"user": {"id": 123}} into a single field user_id with value 123. This keeps your field list flat and searchable. Check “named captures only” in the regex step to avoid polluting the message with intermediate capture groups. Leave the JSON extractor defaults unless you need custom key mapping.
For detailed guidance on setting up JSON extraction workflows, including handling nested structures and field naming, see How to use a JSON Extractor.
Key‑Value extractors handle logs that look like status=200 latency_ms=45 user=alice. The extractor splits on a delimiter (default is space) and then splits each token on an assignment character (default is =). You get three fields: status, latency_ms, and user. CSV extractors work the same way but expect a fixed column order. You define column names in order, and the extractor maps each delimited value to the corresponding field. Use CSV extractors for tab separated logs or when a log producer outputs structured records without JSON.
Flattening strategies matter when JSON is deeply nested. Flatten when you need all data at the top level for fast aggregation. Skip flattening if you want to preserve the hierarchy for debugging or when nested objects are variable. Field naming conventions help: prefix extracted fields with a namespace (e.g., nginxaccesslog_status) to avoid collisions when multiple inputs write to the same index. Test flattening with a sample message and check the resulting field list before saving the extractor.
| Extractor Type | Ideal Use Case |
|---|---|
| JSON | Embedded JSON blobs in syslog or application logs; works best with predictable structure |
| Key‑Value | Logs with field=value pairs (e.g., query strings, application debug output, custom delimited formats) |
| CSV | Fixed column delimited records when column order is known and consistent |
Graylog Pipeline Rules vs Extractors: When to Use Each Parsing Method

Pipelines attach to streams and offer more flexibility than extractors. A pipeline can run conditional logic across multiple fields, reorder processing into stages, call functions that extractors can’t access. Extractors run on every message hitting an input unless you add conditions. Pipelines run only on messages that enter a connected stream. If you need to parse based on a field that another rule already extracted, pipelines let you chain rules in sequence. Extractors can’t read fields created by other extractors in the same message batch.
Pipelines use stages to control execution order. Stage 0 runs first, and you can configure it to “continue processing if none or more rules match,” which means the message moves to the next stage even when no rules fire. Stage 1 and beyond run after Stage 0 completes. For example, in a Pi‑Hole parsing setup, you might place six conditional rules in Stage 0 to handle different log formats, then add a base GROK rule in Stage 1 that extracts common fields. This separation ensures the base rule always runs, even when the specific format rules don’t match.
Decision criteria for choosing pipelines over extractors:
- You need to parse based on a field that was extracted earlier in the same processing flow.
- You want to run different parsing logic for messages routed to different streams.
- You need functions beyond pattern matching, like date parsing, GeoIP lookup, or key renaming.
- You’re managing dozens of parsing rules and want to organize them into logical stages with clear dependencies.
Example Pipeline Staging Flow
Stage 0 contains conditional rules that target specific log formats. Each rule checks a condition (e.g., “does full_message contain ‘query[A]’?”), and if true, runs a GROK pattern to extract fields. The stage configuration is set to “allow continue if none or more rules match,” so even if zero rules fire, the message proceeds to Stage 1. Stage 1 holds the base GROK rule, which extracts timestamp, hostname, and other universal fields that appear in every message from that source. This guarantees baseline fields are always present, while format specific fields are added only when the message matches a Stage 0 rule.
Graylog Extractor Performance, Scoping, and Index Impact

Extractors run on every message unless you add conditions, so an extractor with a complex pattern and no scoping will test that pattern against every single message on the input. If the input receives 10,000 messages per second and only 100 match, you’ve wasted CPU cycles on 9,900 messages. Use regex based conditions to filter early. A condition like full_message must match regex ^\[nginx\] ensures the extractor only runs when the message starts with [nginx], cutting unnecessary work.
Field explosion happens when extractors create too many unique field names. Elasticsearch builds an index mapping for every field, and mappings consume memory. If your extractor creates dynamic field names based on log content (e.g., user12345, user67890), you’ll generate thousands of fields and degrade index performance. Stick to a fixed schema. Extract user IDs into a single user_id field, not one field per user.
Five performance and schema tips:
- Add regex conditions to every extractor so parsing only runs on relevant messages.
- Keep total field count per index below 1,000 if possible. Beyond that, search slows and mapping memory grows.
- Use the Copy extraction strategy (WORM—Write Once, Read Many) to preserve the original message field. This lets you reprocess or debug later without losing data.
- Limit GREEDYDATA captures to the end of a pattern. Matching .* in the middle of a regex forces backtracking and burns CPU.
- Test extractors on a sample of real traffic before deploying. A pattern that works on one log line might fail or run slowly on edge cases with unexpected formatting.
Troubleshooting Graylog Extractors and Common Misconfigurations

When extractors don’t produce fields, start by verifying that new messages are arriving. Extractors only work on messages received after creation, so if you’re testing with old logs, nothing will happen. Open Show Received Messages on the input and confirm that fresh messages are flowing. If the input is silent, the problem is upstream. Check network forwarding, firewall rules, the log source configuration.
Use tcpdump to verify traffic reaches Graylog. Run tcpdump -Xn port 514 (or whatever port your input listens on) to capture raw packets. If Graylog and the log source run on the same host, add -i lo between tcpdump and -Xn to capture loopback traffic. If tcpdump shows packets but Graylog doesn’t index them, check the input configuration, especially the port and bind address. If packets aren’t visible in tcpdump, the source isn’t sending or a network device is blocking.
Test your patterns outside Graylog before deploying. For regex extractors, use a site like regex101. For GROK, use a GROK debugger. Paste a real log line, try your pattern, iterate until fields appear. Silent failures in production are hard to debug. Local testing catches most issues in seconds. Check that named captures use the colon syntax correctly (%{PATTERN:fieldname}), and verify that regex special characters are escaped when you paste patterns into Graylog.
Six common extractor mistakes and fixes:
- Extractor runs on all messages — Add a regex condition to scope processing to matching messages only.
- Pattern works in debugger but fails in Graylog — Check that you selected the correct message field (full_message vs message) and that “Store full message” is enabled on the input if you need the original payload.
- No fields appear after saving the extractor — Extractors only affect new messages. Send fresh logs and check again.
- Fields appear but values are wrong — Review named capture groups and ensure the pattern accounts for variations in log format (extra spaces, optional fields, etc.).
- Extractor causes high CPU load — Tighten the condition or simplify the regex. Avoid nested GREEDYDATA and unbounded wildcards in the middle of patterns.
- JSON extractor fails silently — Confirm the previous extractor produced valid JSON. Inspect the intermediate field in a sample message to verify syntax.
Final Words
In the action, we showed how extractors convert raw log text into structured fields, walked the UI setup, and gave Grok/Regex plus JSON, KV, and CSV examples.
We also compared pipelines vs extractors, shared performance tips to avoid field explosion and wasted CPU, and listed troubleshooting steps to test patterns and verify inputs.
Test on real messages, scope extractors to the right input, and keep names tidy. A well-tuned graylog extractor saves time and keeps dashboards and alerts reliable—go try it out.
FAQ
Q: What is a Graylog extractor?
A: A Graylog extractor is a component that parses incoming unstructured log messages into structured fields stored in Elasticsearch. Types include Grok, Regex, JSON, KV, and CSV; they run on inputs and affect new messages only.
Q: What is the difference between extractor and pipeline in Graylog?
A: The difference between extractors and pipelines is that extractors run on inputs to do inline parsing of new messages, while pipelines attach to streams, use staged rule processing, offer richer logic and simulation, and suit complex transformations.
Q: What is Graylog used for?
A: Graylog is used for centralizing logs: ingesting, parsing, indexing, searching, building dashboards, and alerting so teams can monitor systems, investigate incidents, and store logs long term in Elasticsearch.
Q: What are the cons of Graylog?
A: The cons of Graylog are higher resource needs due to Elasticsearch, potential field explosion from extractors, extractors only affect new messages, silent failures on non-matches, and a learning curve for pipelines and tuning.