


What if the package causing your production outage is three layers deep and you don’t even know how it got there?
Dependency graph analyzers turn flat package lists into interactive maps that show who depends on who, where cycles hide, and which libraries carry the most risk.
This post walks through core capabilities, compares Graphviz, D3, and Webpack Bundle Analyzer, and gives a quick workflow to generate and read a graph so you can find fragile modules, fix cycles, and trace vulnerabilities fast.
Understanding Dependency Graph Analyzer Fundamentals

A dependency graph analyzer maps relationships between packages, modules, files, or components in your codebase. Nodes represent the components. Edges show how they depend on each other. You’re not scanning flat lists in package.json or requirements.txt anymore. The analyzer builds a structured graph that shows which library depends on which, how deep the chains run, and where circular references hide. It’s an X-ray for your architecture. You can see clusters of tightly coupled modules, orphaned code that nothing imports, and the single shared library half your application relies on.
These tools detect cycles. Loops where two or more components depend on each other, creating fragile refactoring situations and build order headaches. They also expose transitive dependencies, the libraries you never added directly but inherited three layers down from something you installed. A topological view can sort components by dependency order, showing which pieces must be initialized or built first. When a package you’ve never heard of throws a security alert, a dependency graph reveals exactly how it entered your project and which modules pull it in.
Output formats vary. Graphviz writes plain-text DOT files that describe nodes and edges. D3.js consumes JSON or JavaScript objects to render interactive, browser-based graphs. Webpack Bundle Analyzer reads your package.json and build manifests to produce a zoomable treemap of module sizes. All these formats serve the same goal: move from abstract package lists to concrete visual structures you can debug, refactor, and optimize. When you’re facing thousands of nodes and edges, an analyzer becomes the only practical way to understand what’s actually connected and why.
Key Capabilities in Modern Dependency Graph Analyzer Tools

Cycle detection is table stakes. An analyzer scans your graph and flags closed loops where module A imports B, B imports C, and C circles back to A. Fixing these requires rethinking module boundaries or introducing an intermediary. The analyzer shows you every participant in the loop. Transitive analysis digs beyond your direct imports to capture the entire dependency tree. If you call npm install lodash, the analyzer doesn’t stop there. It maps every package lodash itself needs and every package those packages need, all the way down.
Impact evaluation answers “If I upgrade this library, what breaks?” by highlighting every downstream consumer. Tools identify high fan-in nodes, libraries imported by dozens of other modules, so you know which upgrades will have the widest blast radius.
Most analyzers offer fan-in and fan-out metrics showing how many modules depend on a package and how many it depends on. Redundancy detection spots duplicate versions of the same library living at different transitive depths. Topological sorting establishes safe build or initialization order. Version drift discovery flags mismatched minor or patch versions across the graph. Real-time updates in tools like Tom Sawyer Perspectives or D3.js dashboards refresh as code changes.
These capabilities let you ask targeted questions. Which module touches the most code? Where are the circular dependencies? Which packages are dragging in ten other libraries for a single function?
Comparing Popular Dependency Graph Analyzer Tools

Tools range from lightweight command-line renderers to enterprise platforms with dynamic layouts and collaboration features. Each fits different ecosystems, scale requirements, and visualization preferences.
Graphviz
Graphviz reads DOT files, plain-text definitions of nodes and edges, and generates static diagrams with algorithms like dot (hierarchical), neato (spring), or sfdp (scalable force-directed). It’s fast, scriptable, and works for any language as long as you can output DOT. Best for quick static snapshots or batch-generated reports in CI.
D3.js
D3.js is a JavaScript library that binds graph data (usually JSON) to SVG elements in the browser. You feed it an object with nodes and links, and it renders force-directed, hierarchical, or custom layouts with full interactivity. Zoom, pan, hover tooltips, and clickable nodes. Perfect for embedding live dependency visualizations in dashboards or documentation sites.
Gephi
Gephi is a desktop application for network exploration. It imports graphs in GEXF, GraphML, or CSV, then offers dynamic filtering, clustering algorithms, and community detection. Strong for analyzing large, messy graphs and discovering hidden module communities. Popular in research and data science, less common in day-to-day development.
Tom Sawyer Perspectives
Tom Sawyer Perspectives is an enterprise low-code platform with an SDK for building custom graph applications. It supports nested drawings (graphs within nodes), real-time updates as data streams in, and dynamic layouts that reorganize automatically. Built for dependency networks at the scale of hundreds of microservices or thousands of database objects.
CppDepend and JArchitect
CppDepend and JArchitect are premium static analyzers for C++ and Java. They generate dependency graphs alongside code metrics, architectural compliance checks, and cycle reports. They parse source directly and show class-level, namespace-level, and assembly-level dependencies. Best when you need deep code insight, not just package-level relationships.
Webpack Bundle Analyzer
Webpack Bundle Analyzer visualizes JavaScript bundles as interactive treemaps showing which modules consume the most space. It reads package.json and Webpack stats to break down your production bundle. Perfect for frontend developers hunting down bloated dependencies that inflate download sizes.
| Tool | Format/Language | Ideal Use Case |
|---|---|---|
| Graphviz | DOT (plain text) | Batch static diagrams, CI reports, cross-language graphs |
| D3.js | JSON/JS in browser | Interactive web dashboards, real-time updates, custom layouts |
| Gephi | GEXF, GraphML, CSV | Network analysis, clustering, community detection in large graphs |
| Tom Sawyer Perspectives | SDK/low-code, nested graphs | Enterprise-scale microservices, real-time dependency monitoring |
| Webpack Bundle Analyzer | package.json, Webpack stats | Frontend bundle size optimization, module weight inspection |
How Dependency Graph Analyzers Generate and Visualize Relationships
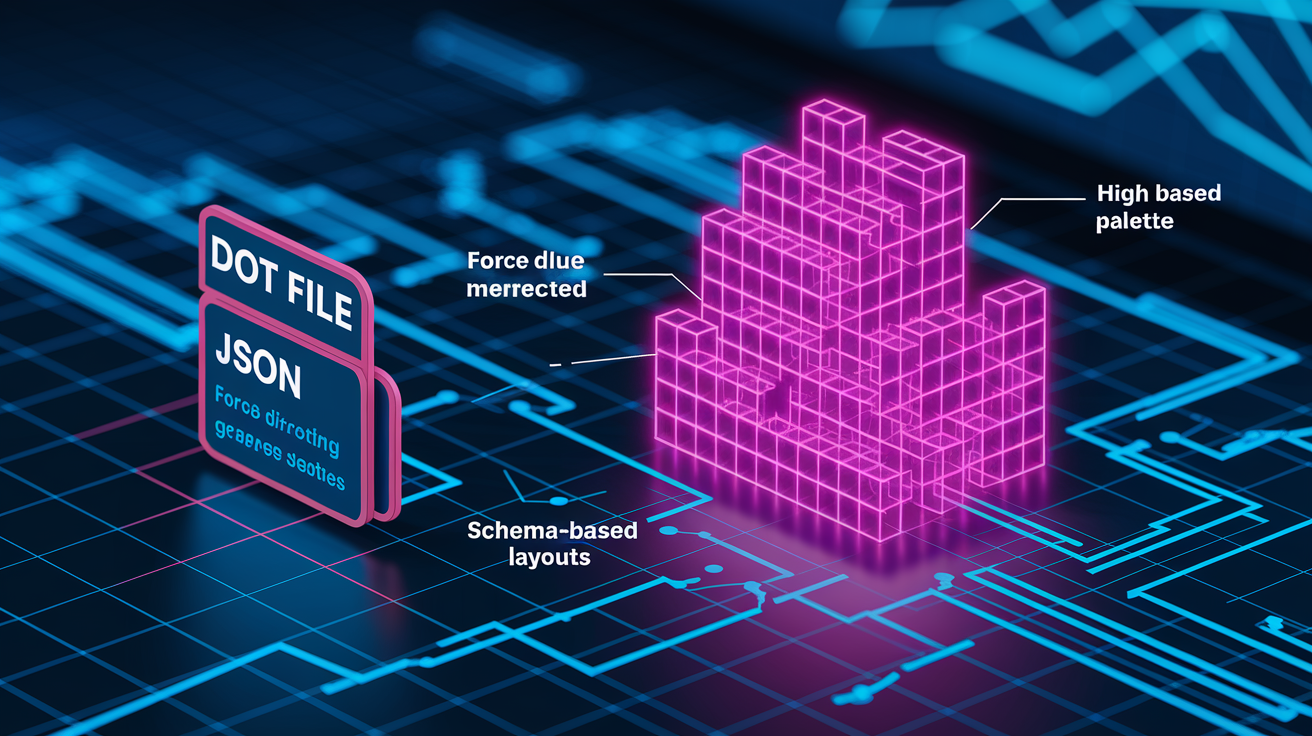
Graph generation starts with static analysis or build-tool introspection. For JavaScript, npm ls or yarn list outputs the full dependency tree. Java projects run mvn dependency:tree, Go uses go mod graph, Python relies on pipdeptree, and Rust runs cargo tree. Each command enumerates direct and transitive dependencies, which the analyzer parses into nodes and edges. Once the data’s captured, you define the structure in a format like DOT (Graphviz) or JSON (D3.js), specifying node IDs, labels, and edge pairs.
Layouts organize nodes spatially. Force-directed algorithms treat edges as springs and nodes as charged particles, spreading the graph naturally. Hierarchical layouts stack nodes by level or dependency depth. Schema-based layouts group nodes by namespace or package origin, placing them in columns or clusters. Level-based layouts distribute nodes vertically by build order or initialization sequence. Each layout reveals different patterns. Force-directed highlights tightly coupled clusters, hierarchical shows dependency flow, and clustering exposes module communities.
Steps to create and visualize a graph:
- Identify dependencies using package managers or static analyzers to enumerate all modules and their relationships.
- Structure the data by writing a DOT file or constructing a JSON object with node and edge arrays.
- Select a layout algorithm based on what you want to emphasize. Hierarchy, clusters, or connection density.
- Render the graph with your chosen tool, applying color coding (external libs in red, internal modules in blue) and size scaling based on fan-in or fan-out.
- Enable interactivity such as hover highlights, filtering by node type, and zoom/pan controls to navigate large graphs.
Color coding and curved links with arrowheads clarify direction. Hovering a node can dim unrelated parts of the graph and change link colors. Red for outgoing dependencies, green for incoming, so you instantly see upstream and downstream impact.
Dependency Risk Identification and Vulnerability Mapping With Graphs

Dependency graphs integrate with scanners like OSV-Scanner, Trivy, Semgrep, and CodeQL to overlay vulnerability data onto your module structure. In 2024, 40,009 new CVEs were reported, a 38 percent jump over 2023 and more than 500 percent higher than the 6,449 CVEs logged in 2016. That volume makes flat severity lists useless. A graph shows which vulnerable package sits three layers deep in a transitive chain, which modules import it, and whether production code actually calls the risky functions. When a Java Class Hijack via a transitive JSON library surfaced in 2024, graph analysis revealed the exploit path from the top-level dependency through intermediate libraries to the overridden runtime class.
Reachability matters more than CVSS scores. If a CVE affects a function your code never invokes, or a package only loaded in test fixtures, the real-world risk is low. Analyzers trace call paths from entry points to vulnerable code, flagging only the issues that can be triggered at runtime. High fan-in nodes concentrate risk. If one core library has a flaw, every module depending on it inherits the exposure. Graphs also surface redundant or outdated packages: duplicate versions of the same library at different points in the tree, or ancient patch levels mixed with newer ones. Running npm dedupe or reviewing pipdeptree output consolidates versions and shrinks your attack surface.
Common dependency risks visible in graphs include transitive vulnerabilities buried several layers below your direct imports, malicious or hijacked packages introduced through typosquatting or dependency confusion, typosquatting attacks like the October 2024 npm campaign targeting Ethereum packages (downloaded thousands of times before detection), and license compliance violations when an unnoticed transitive dependency carries a restrictive license incompatible with your project.
Software Bill of Materials (SBOM) tools export dependency lists, but a graph adds context. You see which components are optional dev dependencies, which run in production, and which modules pull in problematic licenses. Pairing graph data with scanner output produces prioritized remediation lists ordered by exploitability, business impact, and reachability instead of raw severity.
Practical Use Cases of Dependency Graph Analyzers in Engineering Workflows

Dependency graph analyzers shine when you need to understand how components fit together under real-world constraints. In microservices architectures, real-time graphs map service-to-service calls, showing which endpoints depend on which backends. This guides rolling update sequences. If Service A calls B and B calls C, you deploy C first, then B, then A. Without a graph, teams guess the order and risk runtime failures.
Webpack Bundle Analyzer reveals module bloat in frontend builds. A quick glance at the treemap shows that a single utility library accounts for 40 percent of your bundle because it imports a heavyweight localization framework. You swap it for a lean alternative and cut load time in half.
Static analyzers like CppDepend and JArchitect map class and namespace dependencies in large C++ or Java codebases, highlighting circular references and suggesting refactoring targets. Data teams use graphs to trace ETL pipeline lineage. Raw sources flow through transformations into final datasets, and the graph documents every step for compliance and debugging.
| Use Case | Value Delivered |
|---|---|
| Microservices dependency mapping | Safe update sequencing, service isolation analysis, blast radius estimation |
| JavaScript bundle optimization | Identify heavy modules, eliminate duplication, reduce production bundle size |
| Refactoring legacy codebases | Find tightly coupled modules, break circular dependencies, prioritize decoupling work |
| Data lineage and ETL tracking | Document data origins, locate slow transformations, prove compliance with data flows |
Integrating Dependency Graph Analysis Into Build and CI/CD Systems

Automated graph generation keeps dependency data current and surfaces issues the moment they’re introduced. Add a step in your CI pipeline that runs npm ls, mvn dependency:tree, or cargo tree on every pull request, pipes the output into an analyzer, and posts the resulting graph or a summary report as a PR comment. If a developer adds a new dependency that pulls in a known CVE or creates a circular reference, the pipeline fails the build and explains why.
Tools like OSV-Scanner integrate directly with GitHub Actions, GitLab CI, or Jenkins to scan dependencies during builds. Combining scanner output with graph data produces contextual alerts: “CVE-2024-1234 affects transitive package X, which is imported by modules A, B, and C in production.” Teams see exactly where the risk lives and whether it’s reachable. Dashboards built with D3.js or Tom Sawyer Perspectives refresh automatically when new commits land, showing how the graph evolves over time.
Automation reduces triage waste. Without it, security teams chase down every flagged CVE only to discover half aren’t reachable and a quarter apply only to test dependencies. With CI-integrated graphs, you answer “Is this exploitable in production?” before opening a ticket. Continuous monitoring also catches version drift (when different parts of the codebase pull incompatible versions of a shared library) and highlights outdated packages that haven’t been bumped in months.
Steps to integrate dependency graph analysis into CI/CD:
- Configure build tools to export full dependency trees on every commit or PR.
- Run graph generation using a lightweight analyzer or script that converts tree output to DOT, JSON, or another structured format.
- Scan for issues by combining graph data with vulnerability scanners, license checkers, and cycle detectors.
- Publish results as build artifacts, PR comments, or interactive dashboards accessible to developers and security teams.
Scaling Dependency Graph Analyzers for Large Codebases

Handling thousands of nodes and edges requires aggressive simplification and performance tuning. Force-directed layouts that work beautifully for 50 nodes become unusable at 5,000. Rendering stalls, interactions lag, and the visual becomes an unreadable hairball. Clustering collapses related nodes into groups, showing high-level module boundaries first and letting users drill down into details. Group all nodes from the same npm package or Java namespace, then expand individual clusters on demand.
Filtering hides low-priority edges and nodes. If you only care about production dependencies, exclude dev and test packages. If you’re hunting performance bottlenecks, filter by module size or import frequency and ignore tiny utility libraries. Splitting large graphs into subgraphs (one per microservice, schema, or layer) keeps each visualization manageable. Modular architectures naturally lend themselves to this: generate a graph per service and a top-level graph showing inter-service links.
Techniques for scaling dependency graph analyzers:
Clustering groups nodes by schema, package, or namespace and displays aggregated metrics before expansion. Lazy rendering loads only visible portions of the graph and defers offscreen nodes until the user pans or zooms. Graph splitting creates separate visualizations for subsystems and a master graph for high-level overview. Minimal DOM manipulation in web-based tools like D3.js reduces re-render overhead by updating only changed elements. Caching layout computations means force-directed or hierarchical positions don’t recalculate on every interaction.
Enterprise tools like Tom Sawyer Perspectives support nested drawings, where a single node can contain an entire subgraph. Click a microservice node and it expands to show internal module dependencies. This keeps the top-level view simple while preserving full detail on demand. Optimized layout algorithms skip unnecessary recalculations and apply heuristics to position nodes efficiently even when the graph changes frequently.
File Formats, Export Options, and Integration With External Systems

Dependency graph analyzers export in multiple formats to fit different workflows. DOT files are plain text that any Graphviz-compatible tool can render. Easy to version control, diff, and generate programmatically. JSON and JavaScript objects suit web dashboards and interactive visualizations built with D3.js or similar libraries. GraphML and GEXF are XML-based graph interchange formats that Gephi, yEd, and academic tools consume. CSV exports flatten graph data into tables for spreadsheet analysis or database import.
Tools like Webpack Bundle Analyzer produce self-contained HTML files with embedded JavaScript, so you can open the visualization in any browser without additional dependencies. Python-based analyzers using Networkx and Pygraphviz export DOT or render directly to PNG, SVG, or PDF for reports and documentation. Interactive dashboards allow filtering by node type, searching for specific modules, and exporting filtered subsets as new graphs. Some platforms push graph data into observability tools or security dashboards, overlaying dependency structure onto runtime telemetry and vulnerability feeds.
| Format | Tool | Typical Use |
|---|---|---|
| DOT | Graphviz, Pygraphviz | Version-controlled static diagrams, batch CI reports |
| JSON/JS | D3.js, custom dashboards | Interactive web visualizations, real-time updates |
| HTML (embedded) | Webpack Bundle Analyzer | Shareable bundle treemaps, offline analysis |
Final Words
In the action, we walked through what a dependency graph visualization is—nodes and edges that reveal cycles, transitive links, and bottlenecks—and common formats like DOT and JSON.
Then we covered key capabilities and tools: cycle detection, impact analysis, fan-in metrics, Graphviz to Webpack Bundle Analyzer, and how layouts (force-directed, hierarchical) shape exploration.
Finally we showed risk mapping, CI/CD integration, scaling tips, and real use cases. Use a dependency graph analyzer to spot cycles, trim bloat, and keep changes safer—small setup, big payoff.
FAQ
Q: What is a dependency graph analyzer and why use it?
A: A dependency graph analyzer visualizes modules as nodes and edges, revealing relationships, complexity, cycles, and bottlenecks so you can debug, refactor, and plan safe changes faster.
Q: How do dependency graph analyzers detect cycles, transitive dependencies, and high-impact nodes?
A: Dependency graph analyzers detect cycles, transitive edges, and high-impact nodes by static or runtime enumeration, topological analysis, fan-in metrics, and interactive highlighting to pinpoint loops and architectural risks.
Q: What file formats and export options do dependency graph analyzers support?
A: Dependency graph analyzers export DOT, JSON/JS, GraphML, GEXF, CSV, SVG, and interactive web bundles so you can load graphs into Graphviz, D3.js, dashboards, or share SBOM-compatible reports.
Q: What core capabilities should I expect from modern dependency graph analyzers?
A: Modern analyzers offer cycle detection, transitive dependency discovery, impact analysis, fan-in/fan-out metrics, redundancy/version drift detection, interactive filtering, and real-time or CI-driven updates.
Q: Which popular tools fit different use cases (Graphviz, D3.js, Gephi, Tom Sawyer, CppDepend/JArchitect, Webpack Bundle Analyzer)?
A: Graphviz for static DOT layouts; D3.js for web interactivity; Gephi for clustering and exploration; Tom Sawyer for enterprise real-time graphs; CppDepend/JArchitect for C++/Java analysis; Webpack Bundle Analyzer for JS bundles.
Q: How do dependency graph analyzers build and visualize relationships?
A: Dependency graph analyzers build graphs by identifying dependency edges, emitting DOT/JSON, applying layouts (force-directed, hierarchical), rendering with color/grouping, and enabling hover, filtering, and clustering to explore large graphs.
Q: How do dependency graphs help find vulnerabilities and support SBOM/CVE mapping?
A: Dependency graphs map CVEs and SBOMs by linking vulnerable packages to reachable components, highlighting high fan-in risk nodes, prioritizing remediation, and integrating scanners like Trivy, OSV-Scanner, or CodeQL.
Q: How can I integrate dependency graph analysis into CI/CD pipelines?
A: You integrate analyzers into CI/CD by auto-generating graphs during builds/PRs (npm ls, mvn dependency:tree, cargo tree), failing on new cycles, posting reports, and updating dashboards for continuous monitoring.
Q: What strategies help scale dependency graph analyzers for large codebases?
A: To scale analyzers, cluster or collapse nodes, lazy-render large regions, split graphs by module, cache layout computations, and minimize DOM updates to keep interactive performance with thousands of nodes.
Q: What quick checks should I run when a graph looks confusing or too dense?
A: When graphs are dense, collapse low-impact nodes, filter by depth or version, switch to a hierarchical layout, search for high fan-in nodes, and export a CSV summary for focused analysis.