


Ever look at a log file and realize you can’t tell when something broke, where it broke, or why it broke? Default Python logging gives you a message and not much else. A custom formatter fixes that by letting you control exactly what information appears in every log entry, from timestamps and severity levels to module names and line numbers. This guide shows you how to build formatters that match your debugging workflow, whether you’re scanning console output during development or parsing production logs at 3 AM.
Understanding Python Log Formatter Basics with Output Examples
A custom log formatter is a class that controls how log messages appear in your application’s output. Python’s logging module gives you a base logging.Formatter class that you extend to customize message structure, timestamps, severity indicators, and contextual info like module names and line numbers.
By default, Python logging produces basic output. If you run logging.warning('Database connection failed'), you’ll see something like this: WARNING:root:Database connection failed. That’s it. No timestamp, no file information, no context beyond the raw message.
With a custom formatter, you can transform that same log into something far more useful: 2025-01-15 14:23:45 WARNING [database.py:127] Database connection failed. You get the exact moment it happened, which file threw the warning, and the line number. All information you need when debugging production issues at 2 AM.
Custom formatters work by extending the logging.Formatter class and defining a format string that specifies which LogRecord attributes to include. The format string uses placeholders like %(levelname)s and %(message)s to pull data from the LogRecord object. When you instantiate your formatter, you pass this format string, and the formatter applies it to every log message that passes through its assigned handler.
Here’s a basic implementation. Create a formatter with your desired format string, attach it to a handler, then add that handler to your logger:
import logging

logger = logging.getLogger('my_app')
logger.setLevel(logging.DEBUG)

formatter = logging.Formatter(
    '%(asctime)s %(levelname)8s [%(module)s:%(lineno)d] %(message)s'
)

console_handler = logging.StreamHandler()
console_handler.setFormatter(formatter)

logger.addHandler(console_handler)
logger.propagate = False
The root logger should be set to DEBUG level to ensure all log messages are passed to the logger object. Setting propagate = False prevents messages from bubbling up to parent loggers when you’re overriding the root logger.
Essential LogRecord Attributes for Format Customization
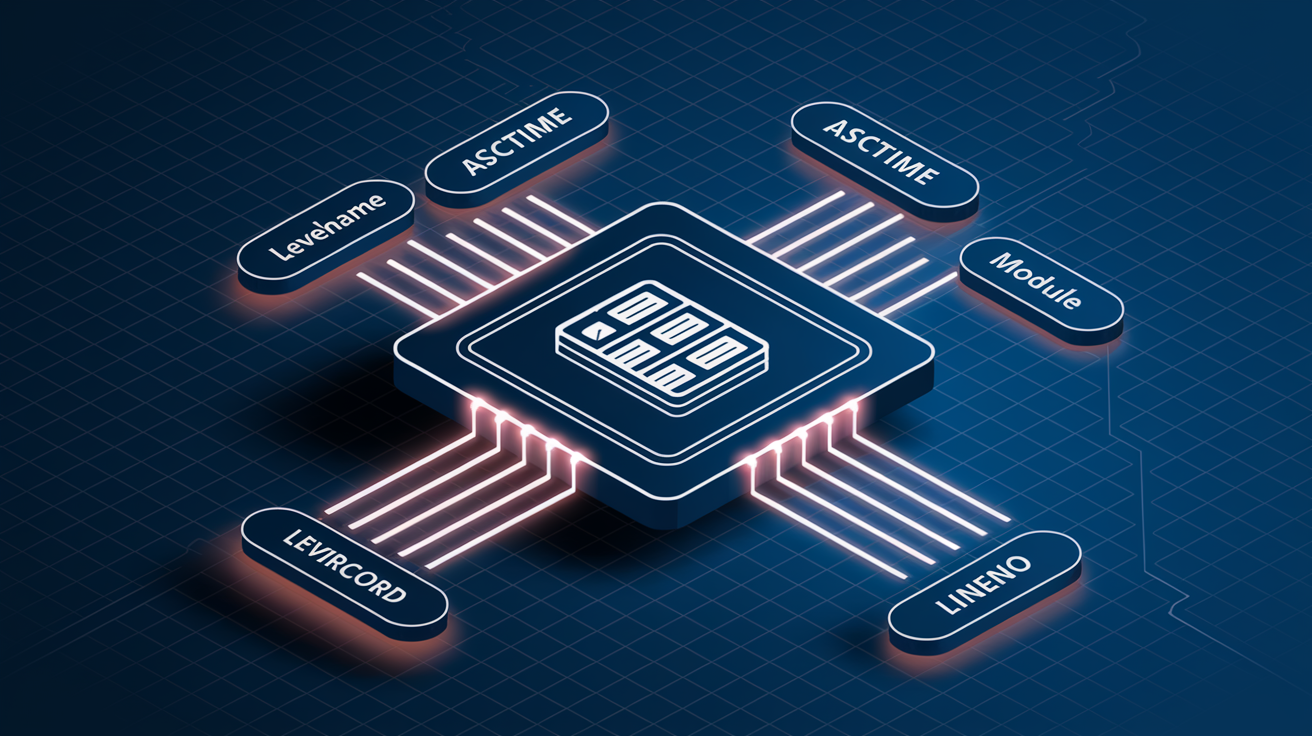
The LogRecord object is the data source for all formatter customization in Python logging. Every time you call logger.info() or any logging method, Python creates a LogRecord instance containing attributes about that specific log event. Who logged it, when, where in the code, and what the message says.
The most commonly used attributes include levelname (DEBUG, INFO, WARNING, ERROR, CRITICAL), asctime (formatted timestamp), name (logger name), message (the actual log content), module (Python file that generated the log), funcName (function where logging occurred), and lineno (line number in source file). You also have access to pathname (full file path), filename (just the file name), process (process ID), thread (thread ID), and threadName (thread name). Each of these can be embedded in your format string using the pattern %(attribute_name)s.
| Attribute | Description | Example Output |
|---|---|---|
| levelname | Severity level text | WARNING |
| asctime | Human-readable timestamp | 2025-01-15 14:23:45,123 |
| name | Logger name | my_app.database |
| message | Log message content | Connection timeout occurred |
| module | Module name (file without .py) | database |
| funcName | Function name | connect_to_db |
| lineno | Line number in source | 127 |
| pathname | Full file path | /app/src/database.py |
| process | Process ID | 12345 |
| thread | Thread ID | 140735268369472 |
Fixed width formatting ensures consistent column alignment across log entries. Use syntax like %(levelname)8s to right align level names in an 8 character field, which perfectly fits all five standard Python log levels (DEBUG, INFO, WARNING, ERROR, CRITICAL). This makes scanning logs much easier. Your eyes can quickly jump to the level column and spot all ERROR entries without parsing variable length text.
Timestamp Formatting Techniques in Python Logging

Python’s default timestamp format is YYYY-MM-DD HH:MM:SS,mmm, which looks like 2025-01-15 14:23:45,123. It’s readable but not always what you need. The comma separated milliseconds don’t play well with many log parsers, and there’s no timezone information, which becomes a problem when you’re debugging distributed systems across multiple regions.
You can override the formatTime method in your custom formatter to control timestamp appearance:
import logging
from datetime import datetime

class CustomFormatter(logging.Formatter):
    def formatTime(self, record, datefmt=None):
        dt = datetime.fromtimestamp(record.created)
        if datefmt:
            return dt.strftime(datefmt)
        return dt.isoformat()
This lets you use any datetime format string you want. ISO 8601 format (2025-01-15T14:23:45.123456) is machine parseable and sorts correctly. For human readers, you might prefer %Y-%m-%d %H:%M:%S (2025-01-15 14:23:45) or %b %d %H:%M:%S (Jan 15 14:23:45) for a more compact console view. Web server logs often use %d/%b/%Y:%H:%M:%S (15/Jan/2025:14:23:45). If you’re working with international teams, %Y-%m-%d %H:%M:%S %Z includes timezone abbreviation.
Always log in UTC for production systems. Your application might run in one timezone, your log aggregation in another, and your on call engineer in a third. UTC eliminates confusion. Convert timestamps to UTC before formatting with datetime.utcfromtimestamp(record.created), and include +0000 or Z in your format string to make the timezone explicit.
Handler and Formatter Configuration in Python Logging

Handlers determine where your logs go. Console, file, network socket, email, or any custom destination. Formatters control how those logs look once they arrive. The relationship is straightforward: you create a formatter, attach it to a handler, then add that handler to your logger. One formatter can serve multiple handlers, or each handler can have its own formatter with different detail levels.
Setting up handlers and formatters programmatically follows this sequence:
- Create your formatter instance with a format string:
formatter = logging.Formatter('%(asctime)s %(levelname)s %(message)s') - Create one or more handlers:
console_handler = logging.StreamHandler()for console output orfile_handler = logging.FileHandler('app.log')for file logging - Attach the formatter to each handler:
console_handler.setFormatter(formatter) - Set the handler’s log level if you want it to filter messages:
file_handler.setLevel(logging.INFO)will skip DEBUG messages but log everything else - Add all handlers to your logger:
logger.addHandler(console_handler)andlogger.addHandler(file_handler)
For simple cases where you just need basic formatting, use basicConfig instead of the full setup. This one liner configures the root logger with a format string: logging.basicConfig(format='%(asctime)s %(levelname)s %(message)s', level=logging.INFO). It’s fast, it works, but you lose fine grained control over individual handlers and can’t easily adjust configuration later.
Dictionary based configuration handles complex scenarios with multiple loggers, handlers, and formatters. You define everything in a nested dictionary structure, then pass it to logging.config.dictConfig(). This approach works well when loading configuration from YAML or JSON files. Your logging setup becomes external configuration instead of hardcoded Python.
import logging.config

config = {
    'version': 1,
    'formatters': {
        'simple': {'format': '%(levelname)s %(message)s'},
        'detailed': {'format': '%(asctime)s %(name)s %(levelname)s %(message)s'}
    },
    'handlers': {
        'console': {
            'class': 'logging.StreamHandler',
            'formatter': 'simple',
            'level': 'DEBUG'
        },
        'file': {
            'class': 'logging.FileHandler',
            'filename': 'app.log',
            'formatter': 'detailed',
            'level': 'INFO'
        }
    },
    'root': {
        'level': 'DEBUG',
        'handlers': ['console', 'file']
    }
}

logging.config.dictConfig(config)
Multiple handlers with different formatters let you optimize for different audiences. Your console handler can use a compact, colorized format for developers watching logs in real time. Your file handler can use a detailed format with full timestamps and module paths for post incident analysis. StreamHandler directs messages to stdout for real time visibility during program execution. FileHandler can be set to INFO level to exclude DEBUG messages, so your log file doesn’t fill up with verbose development output while still capturing everything INFO and above.
Format String Patterns for Different Python Logging Scenarios

Different logging scenarios need different formatting strategies. A developer debugging locally wants different information than an operations team parsing production logs, and what works for interactive console output doesn’t work for machine processing.
| Pattern Type | Format String | Example Output |
|---|---|---|
| Standard with Timestamp | %(asctime)s %(levelname)8s %(name)s %(message)s | 2025-01-15 14:23:45 INFO my_app Request completed |
| Compact for Console | %(levelname)s [%(module)s] %(message)s | WARNING [database] Connection timeout |
| Detailed for Debugging | %(asctime)s %(levelname)s [%(pathname)s:%(lineno)d] %(funcName)s – %(message)s | 2025-01-15 14:23:45 ERROR [/app/src/database.py:127] connect_to_db – Connection failed |
| Web Server Style | %(asctime)s %(process)d %(levelname)s %(message)s | 2025-01-15 14:23:45 12345 INFO GET /api/users 200 |
| Syslog Style | %(name)s[%(process)d]: %(levelname)s %(message)s | my_app[12345]: ERROR Database connection refused |
Development environments benefit from human readable formats with visual cues. Use colorized output, compact module names instead of full paths, and omit timestamps when you’re watching logs scroll by in real time. The relative order matters more than exact milliseconds. Production environments need structured, machine parseable formats. JSON logging is ideal here because it integrates cleanly with log aggregation tools and makes searching specific fields trivial.
Alignment matters for readability. Right aligning level names on 8 characters (%(levelname)8s) ensures DEBUG, INFO, WARNING, ERROR, and CRITICAL all line up vertically, making it easy to scan for errors. Left padding shorter values with spaces keeps columns consistent. When you’re looking through hundreds of log lines, that consistent structure lets your eyes jump straight to the information you need without parsing variable length prefixes.
Creating Color Coded Console Formatters in Python

Color coded logs make severity levels instantly recognizable. Spot red ERROR messages at a glance instead of reading each line to find problems. During active development, colored console output saves time. You can watch your application run and immediately see when something goes wrong without parsing text.
ANSI escape codes add color to terminal output. The pattern is \033[Xm where X is a color code. 31 for red, 32 for green, 33 for yellow, etc. Wrap your text with a color code and end with \033[0m to reset formatting. For example, \033[31mERROR\033[0m prints ERROR in red.
Here’s a complete color formatter that assigns different colors to each log level:
import logging

class ColoredFormatter(logging.Formatter):
    COLORS = {
        'DEBUG': '\033[36m',     # Cyan
        'INFO': '\033[32m',      # Green
        'WARNING': '\033[33m',   # Yellow
        'ERROR': '\033[31m',     # Red
        'CRITICAL': '\033[35m'   # Magenta
    }
    RESET = '\033[0m'

    def format(self, record):
        levelname = record.levelname
        if levelname in self.COLORS:
            record.levelname = f"{self.COLORS[levelname]}{levelname}{self.RESET}"
        return super().format(record)
This formatter intercepts each LogRecord, wraps the level name in ANSI codes, then calls the parent format method. Your format string stays the same. The color application happens transparently. Attach this formatter to a StreamHandler for colored console output while your FileHandler uses a standard formatter for plain text log files.
If you need cross platform color support or don’t want to manage ANSI codes yourself, use the colorama library. colorama.init() makes ANSI codes work on Windows terminals, and it provides cleaner syntax like Fore.RED instead of escape sequences. The tradeoff is adding an external dependency, which might not be acceptable for libraries or minimal deployment environments.
JSON Log Formatting for Machine Processing

JSON formatted logs transform free form text into structured data that log aggregation tools can parse, index, and search efficiently. Instead of parsing timestamps and levels out of string formats, you get clean key value pairs that databases and monitoring systems understand natively.
Create a JSON formatter by overriding the format method and using json.dumps() to serialize LogRecord attributes:
import logging
import json
from datetime import datetime

class JsonFormatter(logging.Formatter):
    def format(self, record):
        log_data = {
            'timestamp': datetime.utcfromtimestamp(record.created).isoformat(),
            'level': record.levelname,
            'logger': record.name,
            'message': record.getMessage(),
            'module': record.module,
            'function': record.funcName,
            'line': record.lineno
        }

        if record.exc_info:
            log_data['exception'] = self.formatException(record.exc_info)

        return json.dumps(log_data)
This produces output like {"timestamp": "2025-01-15T14:23:45.123456", "level": "ERROR", "logger": "my_app", "message": "Connection failed", "module": "database", "function": "connect", "line": 127}. Every field is immediately queryable in your log aggregation system.
Adding custom fields like correlation IDs makes distributed tracing possible. When a request enters your system, generate a unique ID and attach it to all logs related to that request. In microservices architectures, propagate the correlation ID across service boundaries so you can trace a single request through multiple services:
logger.info('Processing request', extra={'correlation_id': request_id, 'user_id': user_id})
Your JSON formatter can pull these extra fields from the LogRecord and include them in the output. Now you can filter all logs for a specific request ID and see the complete flow, even when it spans multiple services, databases, and external API calls.
Integration with centralized logging systems like Elasticsearch, Splunk, or CloudWatch becomes straightforward when logs are already in JSON format. These tools ingest JSON directly, automatically extract fields for indexing, and let you build dashboards and alerts on specific field values without custom parsing logic.
Advanced Formatter Customization with Method Overrides

The logging.Formatter class provides several methods you can override for fine grained control. The main format() method handles the overall formatting logic, but formatTime(), formatException(), and formatStack() control specific aspects and can be customized independently.
Override formatException to control how exception tracebacks appear in your logs. The default traceback format is verbose and includes full paths, which might be more detail than you need or might not match your error tracking format:
import logging
import traceback

class CompactFormatter(logging.Formatter):
    def formatException(self, exc_info):
        tb_lines = traceback.format_exception(*exc_info)
        # Keep only the last 3 lines of traceback
        return ''.join(tb_lines[-3:])
This produces condensed tracebacks that focus on the immediate error without pages of stack frames. Useful when you’re logging to a console or need to keep log file size manageable. For production, you might want the opposite. More context, including local variables at each stack frame, which you can add by using the traceback module’s extended formatting options.
Override formatTime when you need timestamp formats that don’t fit standard strftime patterns. Maybe you’re integrating with a system that expects Unix timestamps as integers, or you need microsecond precision in a specific format:
class UnixTimestampFormatter(logging.Formatter):
    def formatTime(self, record, datefmt=None):
        return str(int(record.created))
The formatStack method handles stack trace formatting when you log with stack_info=True. By default, you get the full call stack leading to the log statement. Override this if you want to filter internal framework calls or format stack frames differently to match your error tracking system’s format.
Adding Contextual Information to Python Log Messages

The extra parameter in logging calls lets you attach custom contextual data to individual log messages. Pass a dictionary of key value pairs, and those become attributes on the LogRecord object that your formatter can access:
logger.info('User logged in', extra={'user_id': 12345, 'ip_address': '192.168.1.1'})
In your format string, reference these fields just like built in attributes: '%(asctime)s %(message)s [user=%(user_id)s ip=%(ip_address)s]'. The formatter pulls values from the LogRecord and inserts them into the output.
Common contextual fields that improve debugging and monitoring:
requestid: unique identifier for each HTTP request or transaction
userid: who initiated the action being logged
sessionid: groups logs from a single user session
correlationid: traces a request across multiple services
environment: dev, staging, prod to distinguish log sources
version: application version for correlating logs with deployments
Here’s how to use these in practice:
import logging
import uuid

logger = logging.getLogger(__name__)

def process_request(user_id):
    request_id = str(uuid.uuid4())
    logger.info('Starting request processing',
                extra={'request_id': request_id, 'user_id': user_id})

    try:
        # Your processing logic here
        logger.debug('Validation passed',
                     extra={'request_id': request_id, 'user_id': user_id})
    except Exception as e:
        logger.error('Request failed',
                     extra={'request_id': request_id, 'user_id': user_id})
        raise
MDC (Mapped Diagnostic Context) pattern attaches context to all logs within a scope without passing extra to every logging call. Python doesn’t have built in MDC support like some languages, but you can implement it with thread local storage or context managers that automatically inject extra fields. This keeps your logging calls clean while still capturing request scoped context like user IDs and request IDs across your entire request handler.
Python Logging Best Practices for Production Environments

Production logging needs different priorities than development. Security, performance, and consistency across services matter more than colorized output and verbose debugging information.
Seven key best practices for production logging:
- Use UTC timestamps with explicit timezone indicators to avoid confusion across distributed systems and global teams
- Maintain consistent format strings across all microservices so logs aggregate cleanly and queries work across service boundaries
- Include unique request IDs in every log entry to enable end to end tracing through your entire stack
- Never log sensitive information like passwords, API keys, credit card numbers, or personally identifiable information (PII) without redaction
- Set appropriate log levels. DEBUG for development environments only, INFO or WARNING for production to avoid performance impact and log volume issues
- Monitor formatter performance in high throughput scenarios where complex JSON conversion or string processing can add milliseconds per log entry
- Use structured formats (JSON) for production, human readable formats for development to optimize for different use cases
Complex formatters can impact performance when your application logs thousands of messages per second. JSON serialization, datetime formatting, and string concatenation all add overhead. Profile your logging in realistic load conditions. If formatting becomes a bottleneck, consider using simpler formats for high frequency DEBUG logs and saving detailed formatting for WARNING and above.
Environment specific formatter strategies keep each environment optimized for its use case. Development gets colorized console output with module names and line numbers for fast debugging. Staging uses JSON format to match production but with DEBUG level enabled for detailed troubleshooting. Production uses JSON with INFO level, correlation IDs for request tracing, and integration with centralized log aggregation. When tracking API requests and responses, structured logging integrates cleanly with API Testing Tools that can parse JSON logs for automated test verification.
Troubleshooting Common Python Formatter Issues
Missing log output usually traces back to level configuration mismatches. The root logger should be set to DEBUG level (the lowest) to ensure all log messages are passed to the logger object. If your logger level is INFO but you’re calling logger.debug(), those messages get filtered before reaching any handlers. Higher log levels ignore lower level messages. INFO level silently drops DEBUG messages, WARNING drops both DEBUG and INFO, and so on.
Format string errors throw exceptions during logging initialization. Watch for typos in attribute names. %(levlname)s instead of %(levelname)s will fail. Using invalid format specifiers like %(asctime)d (trying to format a string as an integer) raises ValueError. The error messages usually point to the exact problem, but they come from deep in the logging module stack, so check your format string first when you see formatting exceptions.
The propagate parameter controls whether log messages pass up the logger hierarchy. When you override the root logger with custom handlers, set propagate = False to prevent messages from being handled twice. Once by your custom handler and once by the default root handler. If you see duplicate log entries, check propagation settings. If you expect logs but see nothing, make sure propagation is enabled if you’re relying on parent loggers to handle output.
Handler and formatter attachment problems show up as logs appearing in wrong formats or not appearing at all. Common issues: forgetting to call handler.setFormatter(formatter) so the handler uses the default format, forgetting to call logger.addHandler(handler) so your carefully configured handler never processes messages, or creating handlers but never adding them to any logger. The setup sequence matters. Formatter to handler, handler to logger. Skip a step and your configuration silently fails. For debugging formatter problems, structured approaches like those covered in Debugging Tools for Developers help trace configuration issues through the logging setup chain.
Final Words
Custom log formatter python skills transform raw console output into production-ready logging systems that save debugging time and improve code quality.
The patterns and techniques here—from basic format strings to JSON formatters and color-coded console output—give you immediate control over how your application communicates what it’s doing.
Start simple. Pick one formatter pattern from this guide, test it in your current project, and expand from there.
Whether you’re shipping a microservice that needs structured JSON logs or building a local tool that benefits from colored console output, you now have the code and context to make it happen.
Your logs should work for you, not against you.
FAQ
How do you format logs in Python?
To format logs in Python, you create a Formatter object with a format string containing LogRecord attributes like %(asctime)s for timestamps and %(levelname)s for severity levels. Attach this formatter to a handler (StreamHandler or FileHandler), then add the handler to your logger to control how messages appear.
How do you create a custom logger in Python?
To create a custom logger in Python, call logging.getLogger('name') to get a logger instance, set its level with setLevel(), create handlers with custom formatters, and add them using addHandler(). Set propagate = False to prevent messages from passing to parent loggers when overriding the root logger.
Can you customize log messages in Python?
Yes, you can customize log messages in Python by extending the logging.Formatter class and overriding methods like format(), formatTime(), or formatException(). You can also add contextual data using the extra parameter in logging calls or create JSON formatters for structured output.
What does .log() do in Python logging?
The .log() method in Python logging records a message at a specified level (DEBUG, INFO, WARNING, ERROR, CRITICAL). For example, logger.log(logging.INFO, 'message') logs at INFO level. Most developers use level-specific methods like logger.info() or logger.error() instead for clearer code.
What LogRecord attributes are available for custom formatting?
LogRecord attributes available for custom formatting include %(levelname)s for severity, %(asctime)s for timestamps, %(message)s for the log text, %(module)s for the module name, %(funcName)s for function names, %(lineno)d for line numbers, and %(process)d and %(thread)d for process and thread IDs.
How do you add timestamps to Python log messages?
To add timestamps to Python log messages, include %(asctime)s in your format string. Override the formatTime() method in a custom Formatter class to change the datetime format. Set timestamps to UTC for production environments to maintain consistency across servers and timezones.
What’s the difference between handlers and formatters in Python logging?
Handlers determine where log messages go (console, file, network), while formatters control how messages appear. You attach a formatter to a handler using handler.setFormatter(formatter), then add the handler to a logger. Different handlers can use different formatters simultaneously for varying output formats.
How do you create colored console logs in Python?
To create colored console logs in Python, build a custom formatter class that uses ANSI escape codes (like \033[91m for red) to color text based on log level. Alternatively, use the colorama library for cross-platform colored output that works on Windows and Unix systems without manual ANSI code handling.
How do you format logs as JSON in Python?
To format logs as JSON in Python, create a custom formatter that overrides the format() method and uses json.dumps() to serialize LogRecord attributes into JSON objects. Include fields like timestamp, level, message, and custom data like correlation IDs for microservices tracing and centralized log aggregation.
How do you add custom fields to Python log messages?
To add custom fields to Python log messages, pass a dictionary to the extra parameter when calling logger methods: logger.info('message', extra={'user_id': 123}). Access these fields in format strings using %(user_id)s. Implement MDC patterns to attach request-scoped context like user IDs automatically.
What are best practices for production Python logging?
Production Python logging best practices include using UTC timestamps, maintaining consistent formats across services, adding unique request IDs for tracing, using JSON formatters for machine parsing, never logging passwords or PII, setting appropriate log levels, and monitoring formatter performance in high-throughput applications.
Why aren’t my Python log messages appearing?
Python log messages may not appear if the logger level is set too high (for example, logger set to WARNING ignores DEBUG messages) or if handler levels filter them out. Check that both logger and handler levels allow your messages through, and verify handlers are properly attached using logger.addHandler().