


Think plain-text logs are good enough? Think again.
Bunyan writes newline-delimited JSON so machines can index and query every field.
In this post we’ll strip Bunyan down to its core JSON shape and explain each required and common optional field, like name, hostname, pid, level, msg, time, v, plus err, req, src, and trace ids.
You’ll get clear rules for what to log, when to use serializers, and quick checks to avoid noisy or expensive fields.
By the end you’ll know exactly how Bunyan structures logs and why it matters for debugging and observability.
Understanding the Core Bunyan Log Format Structure

Bunyan is a JSON-first structured logging library for Node.js. It emits logs in newline-delimited JSON format. Each log entry sits on one line as a complete JSON object, so you can parse, filter, and forward it to downstream aggregators without wrestling with regex patterns or building custom parsers. Bunyan logs are built for machines first and humans second. The raw output is compact and searchable, but if you’re debugging locally you can pipe it through the Bunyan CLI to get pretty, colored output.
Every Bunyan log entry comes with a set of mandatory fields that define the basic context of the event. name identifies the logger or application. hostname shows which machine produced the log. pid records the process ID. level stores a numeric severity code. msg holds the human-readable message. time captures an ISO 8601 timestamp like "2025-06-01T08:00:00.000Z". And v represents the log schema version (usually 0). Together these fields guarantee that every log can be traced back to its source process and understood in time-series order. A minimal Bunyan log entry looks like this: {"name":"myapp","hostname":"host1","pid":12345,"level":30,"msg":"server started","time":"2025-06-01T08:00:00.000Z","v":0}.
Beyond the required fields, Bunyan supports optional extended fields that carry richer context. You can include src to capture file name and line number (useful during development but expensive in production), err to hold an error object with message and stack properties, and req or res to serialize HTTP request and response details. When integrated with distributed tracing systems, you can add OpenTelemetry identifiers like traceId and spanId to correlate logs with traces and metrics across multiple services. Any custom key-value pairs you attach—such as userId, requestId, or orderId—become first-class searchable fields in your log aggregator.
The five core required fields in every Bunyan log entry are:
- name: string (logger or application name)
- hostname: string (host that produced the log)
- pid: integer (process ID)
- level: integer (numeric severity code)
- msg: string (human-readable message text)
Bunyan Log Format Field Meanings and Severity Level Codes

Bunyan uses numeric codes instead of string names for log levels to save space and make filtering by severity ranges more efficient. Higher numbers represent more critical events. This design lets you query “everything above level 30” to exclude trace and debug noise, or “only level 50 and above” to catch errors and fatal events. The numeric approach also simplifies comparisons in parsers and aggregators. No need to maintain a string-to-number lookup table when filtering or building dashboards.
Log levels are ordered from lowest to highest severity. Trace is for ultra-verbose diagnostic output. Debug for developer-facing details. Info for general application flow. Warn for recoverable issues or deprecation notices. Error for failures that need attention. And fatal for catastrophic events that typically precede a process crash. When you call log.info('server started'), Bunyan writes "level":30 into the JSON output.
| Level Name | Numeric Code |
|---|---|
| trace | 10 |
| debug | 20 |
| info | 30 |
| warn | 40 |
| error | 50 |
| fatal | 60 |
Example Bunyan Log Format Output for Real-World Applications

In production, Bunyan logs look like long single lines of JSON. Each represents one event. A typical log entry might include not only the required fields but also custom context like userId, requestId, or endpoint. For example: {"name":"payment-service","hostname":"prod-node-03","pid":8921,"level":30,"msg":"payment processed","time":"2025-03-15T14:22:10.456Z","v":0,"userId":4567,"amount":29.99,"currency":"USD"}. This structure lets you search for all payments by a specific user, filter logs by time range, or aggregate amounts by currency. All without parsing free-form text.
When an error occurs, Bunyan can serialize the full error object into the err field. An error log might look like: {"name":"api-gateway","hostname":"prod-node-01","pid":7654,"level":50,"msg":"database connection failed","time":"2025-03-15T14:22:15.789Z","v":0,"err":{"message":"ECONNREFUSED","stack":"Error: ECONNREFUSED\n at TCPConnectWrap.afterConnect"}}. The err.stack property captures the full call stack, making it easier to trace where the failure originated and what code path led to it.
Reading a sample log entry from top to bottom follows a predictable pattern:
- Identify the source: check
name,hostname, andpidto know which service and process emitted the event. - Assess severity: look at
levelto decide if this is informational, a warning, or critical. - Understand what happened: read
msgfor the human summary and inspect any custom fields for structured context. - Locate in time: use the
timefield to place the event on a timeline and correlate it with other logs or traces.
Pretty-Printing and Human-Readable Viewing of the Bunyan Log Format

Raw Bunyan logs are optimized for machines and log shippers, not for quick visual scans. When you’re debugging locally or reviewing logs in a terminal, one line of dense JSON can be hard to read. Bunyan ships with a CLI tool that transforms NDJSON into a format that’s easier on the eyes. Each log entry gets broken across multiple lines with colorized levels, timestamps in local timezone, and indented fields. You run it by piping your application’s stdout through the bunyan command: node app.js | bunyan.
The Bunyan CLI supports filtering by level, so you can hide trace and debug logs during production troubleshooting. For example, node app.js | bunyan -l warn shows only warnings, errors, and fatals. You can also filter by custom conditions using simple expressions. Useful when you’re chasing a specific requestId or userId and don’t want to scroll through thousands of unrelated entries. The pretty output retains all the structured data but presents it in a way that lets you spot anomalies quickly without needing to mentally parse JSON brackets and commas.
Useful Bunyan CLI patterns and flags:
- Basic pretty-print:
node app.js | bunyan - Filter by level:
node app.js | bunyan -l infoorbunyan -l error - Condition-based filter:
node app.js | bunyan -c 'this.userId === 123' - Output from file:
bunyan production.logto pretty-print saved logs
Custom Serializers and Extending the Bunyan Log Format

Serializers are functions that convert complex or circular objects into JSON-safe shapes before they’re written to the log. Without serializers, trying to log an Error or an HTTP request object can result in lost information or an unserializable circular reference. Bunyan’s serializer system ensures that every field in the final JSON is clean, indexable, and includes the details you actually need. Like error messages and stack traces. Without bloating the log with internal Node.js object properties that aren’t useful for debugging.
Bunyan includes built-in serializers under bunyan.stdSerializers for the most common use cases. The err serializer extracts message, name, stack, and code from Error objects, stripping out internal properties that don’t help with troubleshooting. The req and res serializers pull out key HTTP fields like method, URL, headers, status code, and response time, making request logs queryable by endpoint or status. You configure serializers when you create the logger: bunyan.createLogger({ name: 'myapp', serializers: { err: bunyan.stdSerializers.err, req: bunyan.stdSerializers.req } }).
Creating custom serializers is straightforward. Each serializer is a function that takes an input object and returns a plain JavaScript object. For example, if you want to log database query objects but strip out connection pool internals, you’d write a serializer like query: q => ({ sql: q.sql, duration: q.duration, rows: q.rowCount }). Custom serializers let you control exactly what goes into your logs, redact sensitive fields like passwords or tokens, and keep log volume manageable by excluding verbose metadata that clutters search results and inflates storage costs.
Streams, Destinations, and Output Configuration in the Bunyan Log Format
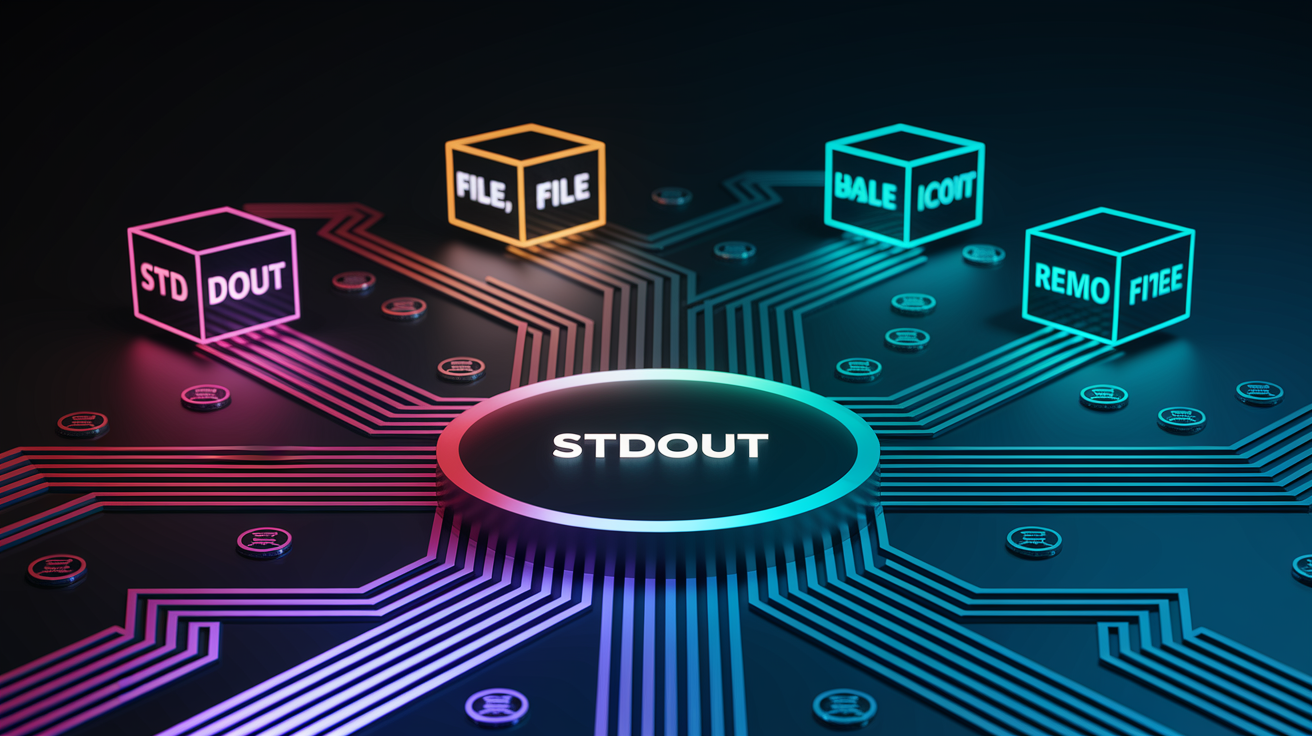
Bunyan uses Node.js streams to send logs to one or more destinations. Each stream can target a different output and have its own log-level threshold, so you can send errors to a file for auditing while keeping info-level messages in stdout for container log collection. Streams are defined when you create the logger, and Bunyan handles routing and formatting transparently. A single logger can write trace-level logs to a local debug file and only error-level logs to a remote syslog endpoint, giving you fine-grained control over where your data goes without changing application code.
The most common destination is stdout, which works seamlessly with container orchestrators like Docker and Kubernetes. Logs written to stdout are automatically captured and forwarded by the container runtime. File streams are useful for long-running processes on VMs or bare metal where you want persistent local logs. For high-throughput applications, you can add a rotating-file stream using a plugin like rotating-file-stream to automatically split logs into hourly or daily chunks and delete old files once they exceed a retention policy. Remote streams let you push logs directly to centralized collectors over TCP or HTTP, though this approach can introduce latency and requires retry logic for reliability.
| Destination | Behavior | Notes |
|---|---|---|
| stdout | Writes JSON lines to standard output | Best for containers; captured by Docker/Kubernetes log drivers |
| File | Appends JSON to a file on disk | Requires rotation strategy to avoid filling disk |
| Rotating file | Writes to time-based or size-based log files | Automatic cleanup; use rotating-file-stream or similar |
| Remote (TCP/HTTP) | Sends logs to a remote endpoint | Needs error handling and buffering for network failures |
Contextual Logging with Child Loggers and Runtime Verbosity Controls

Child loggers inherit all the configuration and context from their parent, then add extra fields that are included in every log entry they emit. This pattern is perfect for request-scoped logging. Create a child logger at the start of each HTTP request with a unique requestId, and every log statement in that request handler will automatically include the ID. You don’t have to manually pass the requestId to every function or risk forgetting to log it. The child logger approach keeps context propagation clean and makes cross-request log correlation trivial in your aggregator.
Creating a child logger is as simple as calling log.child({ requestId: 'abc-123', userId: 987 }). The child inherits the parent’s name, hostname, pid, serializers, and streams, and it adds the extra fields to the base log record. You can nest child loggers, too. If you have middleware that adds sessionId and a downstream handler that adds orderId, each level of nesting layers on more context. This composability makes it easy to build rich, searchable logs without repeating boilerplate in every log statement.
Bunyan also supports changing log levels at runtime without restarting the application. You can expose an admin endpoint that accepts a new level value and updates the logger’s configuration in-place. This lets you turn on debug logging in production to troubleshoot a live issue, then dial it back down once you’ve gathered enough data. This capability is especially valuable in microservices environments where restarting a pod or container can disrupt traffic or take time to propagate through a deployment pipeline. Runtime control means you can increase verbosity on-demand and reduce noise as soon as you’re done investigating.
Parsing, Shipping, and Consuming Bunyan Log Format in Aggregators

Bunyan’s newline-delimited JSON format is designed to be parsed line-by-line. This makes it compatible with nearly every log shipper and stream processor. Each line is a complete, valid JSON object, so you can split on newlines and call JSON.parse on each entry without worrying about partial objects or multi-line strings. This simplicity is why Bunyan logs work out-of-the-box with Fluentd, Logstash, Filebeat, Vector, and OpenTelemetry collectors. These tools all have built-in support for JSON-per-line formats and can extract structured fields immediately without regex patterns.
When shipping logs to an ELK stack (Elasticsearch, Logstash, Kibana) or a cloud-native service like AWS CloudWatch or Google Cloud Logging, you typically configure the shipper to read from a file or stdout stream, parse each line as JSON, and forward the resulting document. In Elasticsearch, Bunyan’s time field (ISO 8601) maps directly to a @timestamp field. Numeric level codes can be translated into human-readable labels using a Logstash filter or an ingest pipeline. For Graylog users, you’ll need to map Bunyan’s numeric levels to syslog severity codes so Graylog’s dashboards display the correct severity names. Bunyan’s level:30 becomes syslog level 6 (informational).
Common ingestion challenges and solutions when working with Bunyan logs:
- Level code translation: map Bunyan numeric codes (10, 20, 30, 40, 50, 60) to syslog or custom severity labels in your aggregator’s parsing config.
- Timezone handling: Bunyan uses ISO 8601 UTC timestamps; ensure your log viewer or dashboard converts them to local time if needed.
- Missing optional fields: not every log will include
err,req, or custom fields; configure your schema to handle optional keys gracefully. - High cardinality fields: fields like
requestIdortraceIdcan create millions of unique values; check that your aggregator indexes them efficiently or samples them. - Multiline stack traces: Bunyan serializes stack traces as single-line strings with
\nescape sequences; most JSON parsers handle this correctly, but some log viewers need special display logic. - Child logger field merging: child loggers add fields to the base record; ensure your aggregator schema allows dynamic field addition without breaking queries.
- Large payloads: logging full HTTP bodies or query results can create multi-kilobyte log lines; use serializers to truncate or summarize data before it’s logged.
- Buffering and backpressure: if your shipper can’t keep up with log volume, Bunyan will block; configure appropriate buffering or use a rotating file as an overflow buffer.
Bunyan Log Format in Microservices, Containers, and Cloud Environments

In containerized deployments, Bunyan’s JSON output to stdout integrates seamlessly with Docker’s logging drivers and Kubernetes log collection. The container runtime automatically captures stdout and stderr streams, and you can configure a logging driver (like json-file, fluentd, or awslogs) to ship logs to a centralized store. Because each log line is already valid JSON, you don’t need an intermediate parsing stage. The shipper reads each line, parses it once, and forwards the structured event to Elasticsearch, Splunk, or a cloud logging service.
For microservices that write logs to files instead of stdout, the typical pattern is to mount a shared host directory into each container and run a separate Fluentd or Filebeat sidecar that tails those files. This approach isolates the log collector from the application container, making it easier to upgrade the collector or change routing rules without redeploying services. When shipping Bunyan logs to Graylog via Fluentd, you’ll need to install a GELF output plugin and map Bunyan’s numeric levels to GELF/syslog codes so Graylog displays the correct severity. A small fork or config adjustment in the GELF plugin handles this mapping, and once configured, Bunyan logs appear in Graylog with all structured fields queryable.
| Environment | Typical Approach | Notes |
|---|---|---|
| Docker containers | Write to stdout; Docker log driver ships JSON | Zero-config for most orchestrators; supports json-file, fluentd, awslogs drivers |
| Kubernetes pods | Stdout captured by kubelet; forwarded by DaemonSet collector | Use Fluentd, Fluent Bit, or Vector as DaemonSet; parse JSON at collector |
| VM or bare-metal services | Write to file; tail with Filebeat or Fluentd | Requires log rotation; shipper reads NDJSON and parses per-line |
| AWS Lambda / serverless | Write to stdout; CloudWatch Logs captures JSON | CloudWatch Insights can query JSON fields directly; configure log retention |
Final Words
We jumped straight into Bunyan’s JSON-first, NDJSON output and its exact shape: required fields, numeric severity codes, sample entries, pretty-printing, serializers, streams, child loggers, and parsing tips.
That gives you a clear checklist when you parse or ship logs – time in ISO 8601, level as a number, err/req/res as optional extras, and traceId/spanId for tracing.
Treat the bunyan log format as a predictable NDJSON contract: validate fields, scrub sensitive data with serializers, route streams correctly, and pretty-print while debugging. Do this and your logs will actually help you fix problems faster.
FAQ
Q: What is the standard for JSON logs and what is a JSON logger?
A: The standard for JSON logs is NDJSON-like structured records – one JSON object per line with fields like timestamp, level, message, and service. A JSON logger emits those structured entries for parsing and indexing.
Q: What is bunyan npm?
A: The bunyan npm is a Node.js logging library that writes newline-delimited JSON with standard fields (name, hostname, pid, level, msg, time, v) and uses numeric severity codes for levels.
Q: Are .log files JSON?
A: The .log files can be JSON but aren’t always. Bunyan-style .log files are NDJSON (one JSON object per line); other apps commonly write plain-text or custom-formatted log lines.